$MEME
#MEME Bullish Zone 🐂
Step 1: Identify the Trend
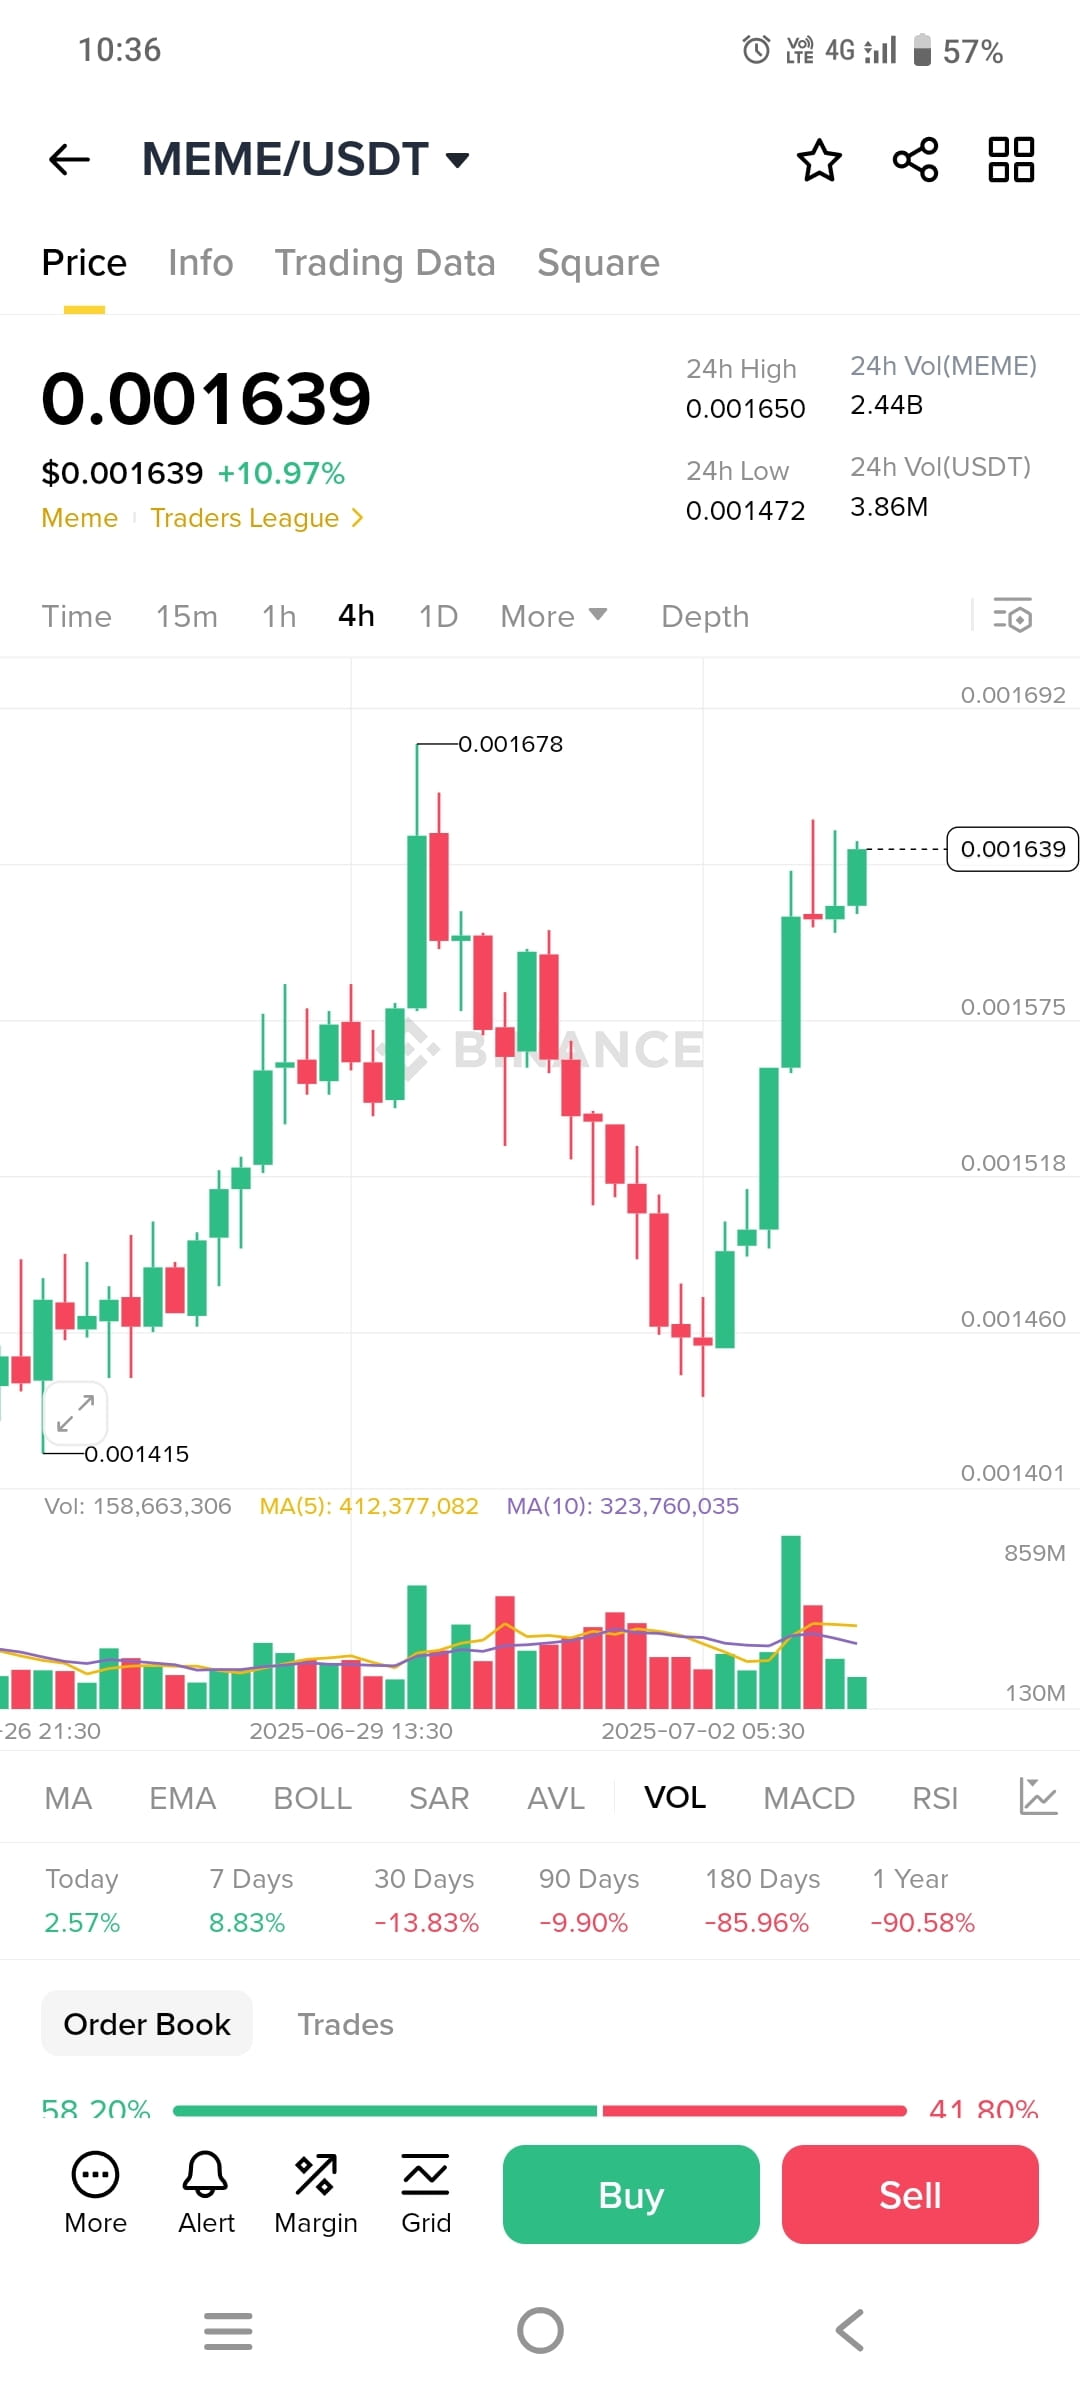
The chart shows an overall uptrend with prices increasing over time. However, prices have declined recently, which could signal a change in momentum.
Step 2: Analyze Indicators
The chart shows several technical indicators, including:
MA (Moving Average): The MA line is trending up, indicating a bullish trend.
EMA (Exponential Moving Average): The EMA line is also trending up, confirming a bullish trend.
BOLL (Bollinger Bands): The Bollinger Bands are narrowing, indicating increased volatility.
SAR (Parabolic Stop and Reversal): The SAR indicator is below the price, indicating a bullish trend.
AVL (Average Volume): The average volume is increasing, indicating increased buying pressure.
VOL (Volume): The volume is increasing, confirming increased buying pressure.
MACD (Moving Average Convergence/Divergence): The MACD line is above the signal line, indicating a bullish crossover.
RSI (Relative Strength Index): RSI is above 50, indicating a bullish trend.
Step 3: Identify Momentum Signal
Based on the analysis of the indicators, the momentum signal is a buy. The overall trend is bullish and the indicators also confirm this trend. The recent drop in price could be a buying opportunity as the indicators suggest that the price may rise in the near future.
#IndianStocks