


Ethereum (ETH) enters May 2025 trading near $1,845, following a strong bounce from its April lows. After months of bearish pressure, ETH is attempting to reclaim key resistance levels that could determine its trajectory for the rest of Q2 2025. While the market remains cautious, several technical indicators are beginning to show signs of strength.
Weekly Chart: Ethereum Testing Major Fibonacci Support
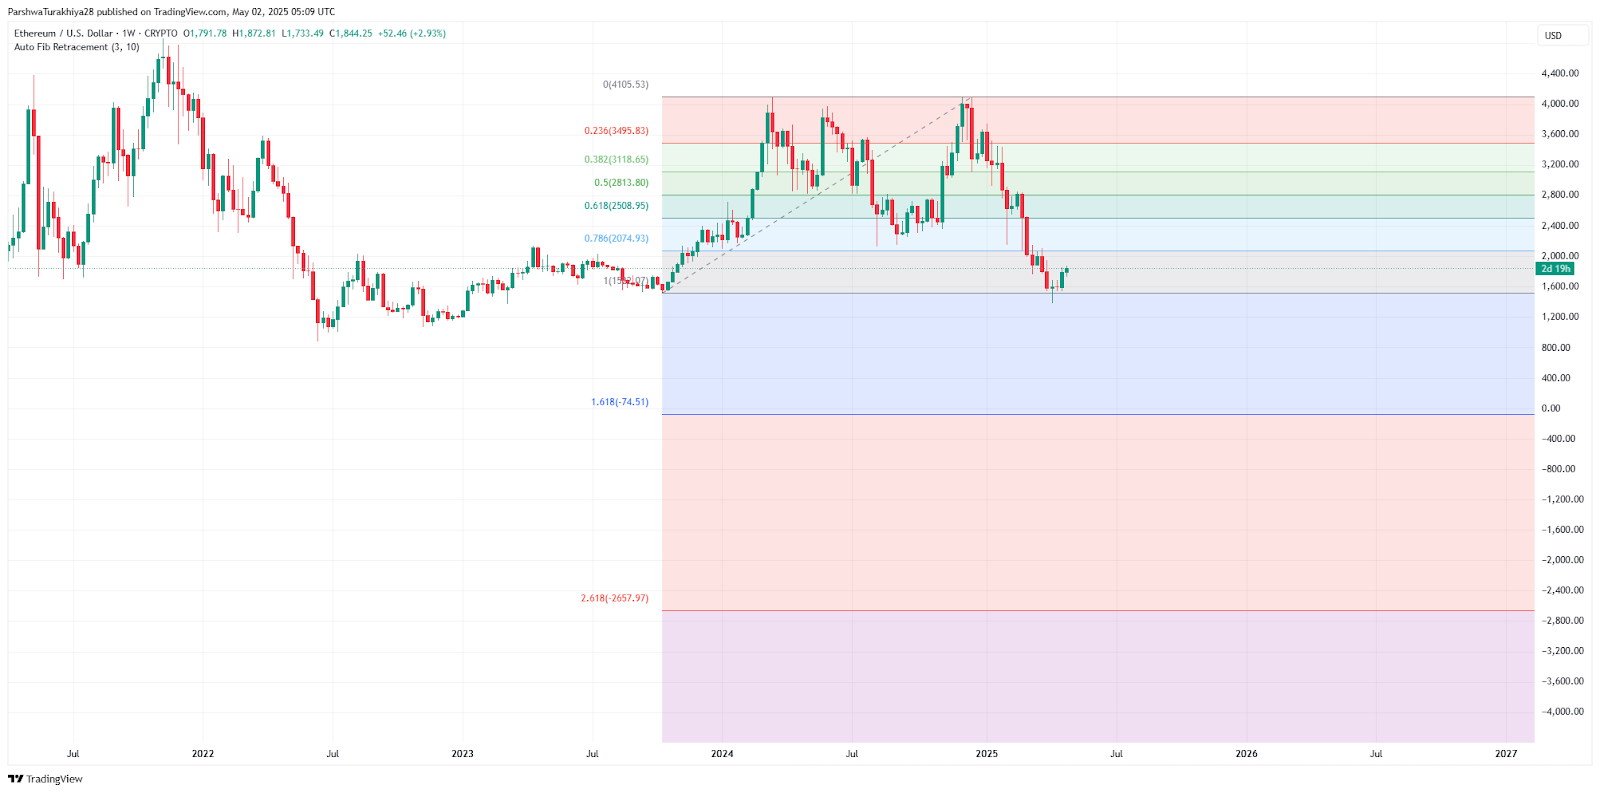
On the weekly timeframe, Ethereum is recovering from the 0.786 Fibonacci retracement level around $2,075, derived from the $1,097 low to the $4,105 cycle high. This region has historically served as a rebound zone for ETH.
This setup suggests Ethereum is still in a broader correction phase, but signs of a base are building.
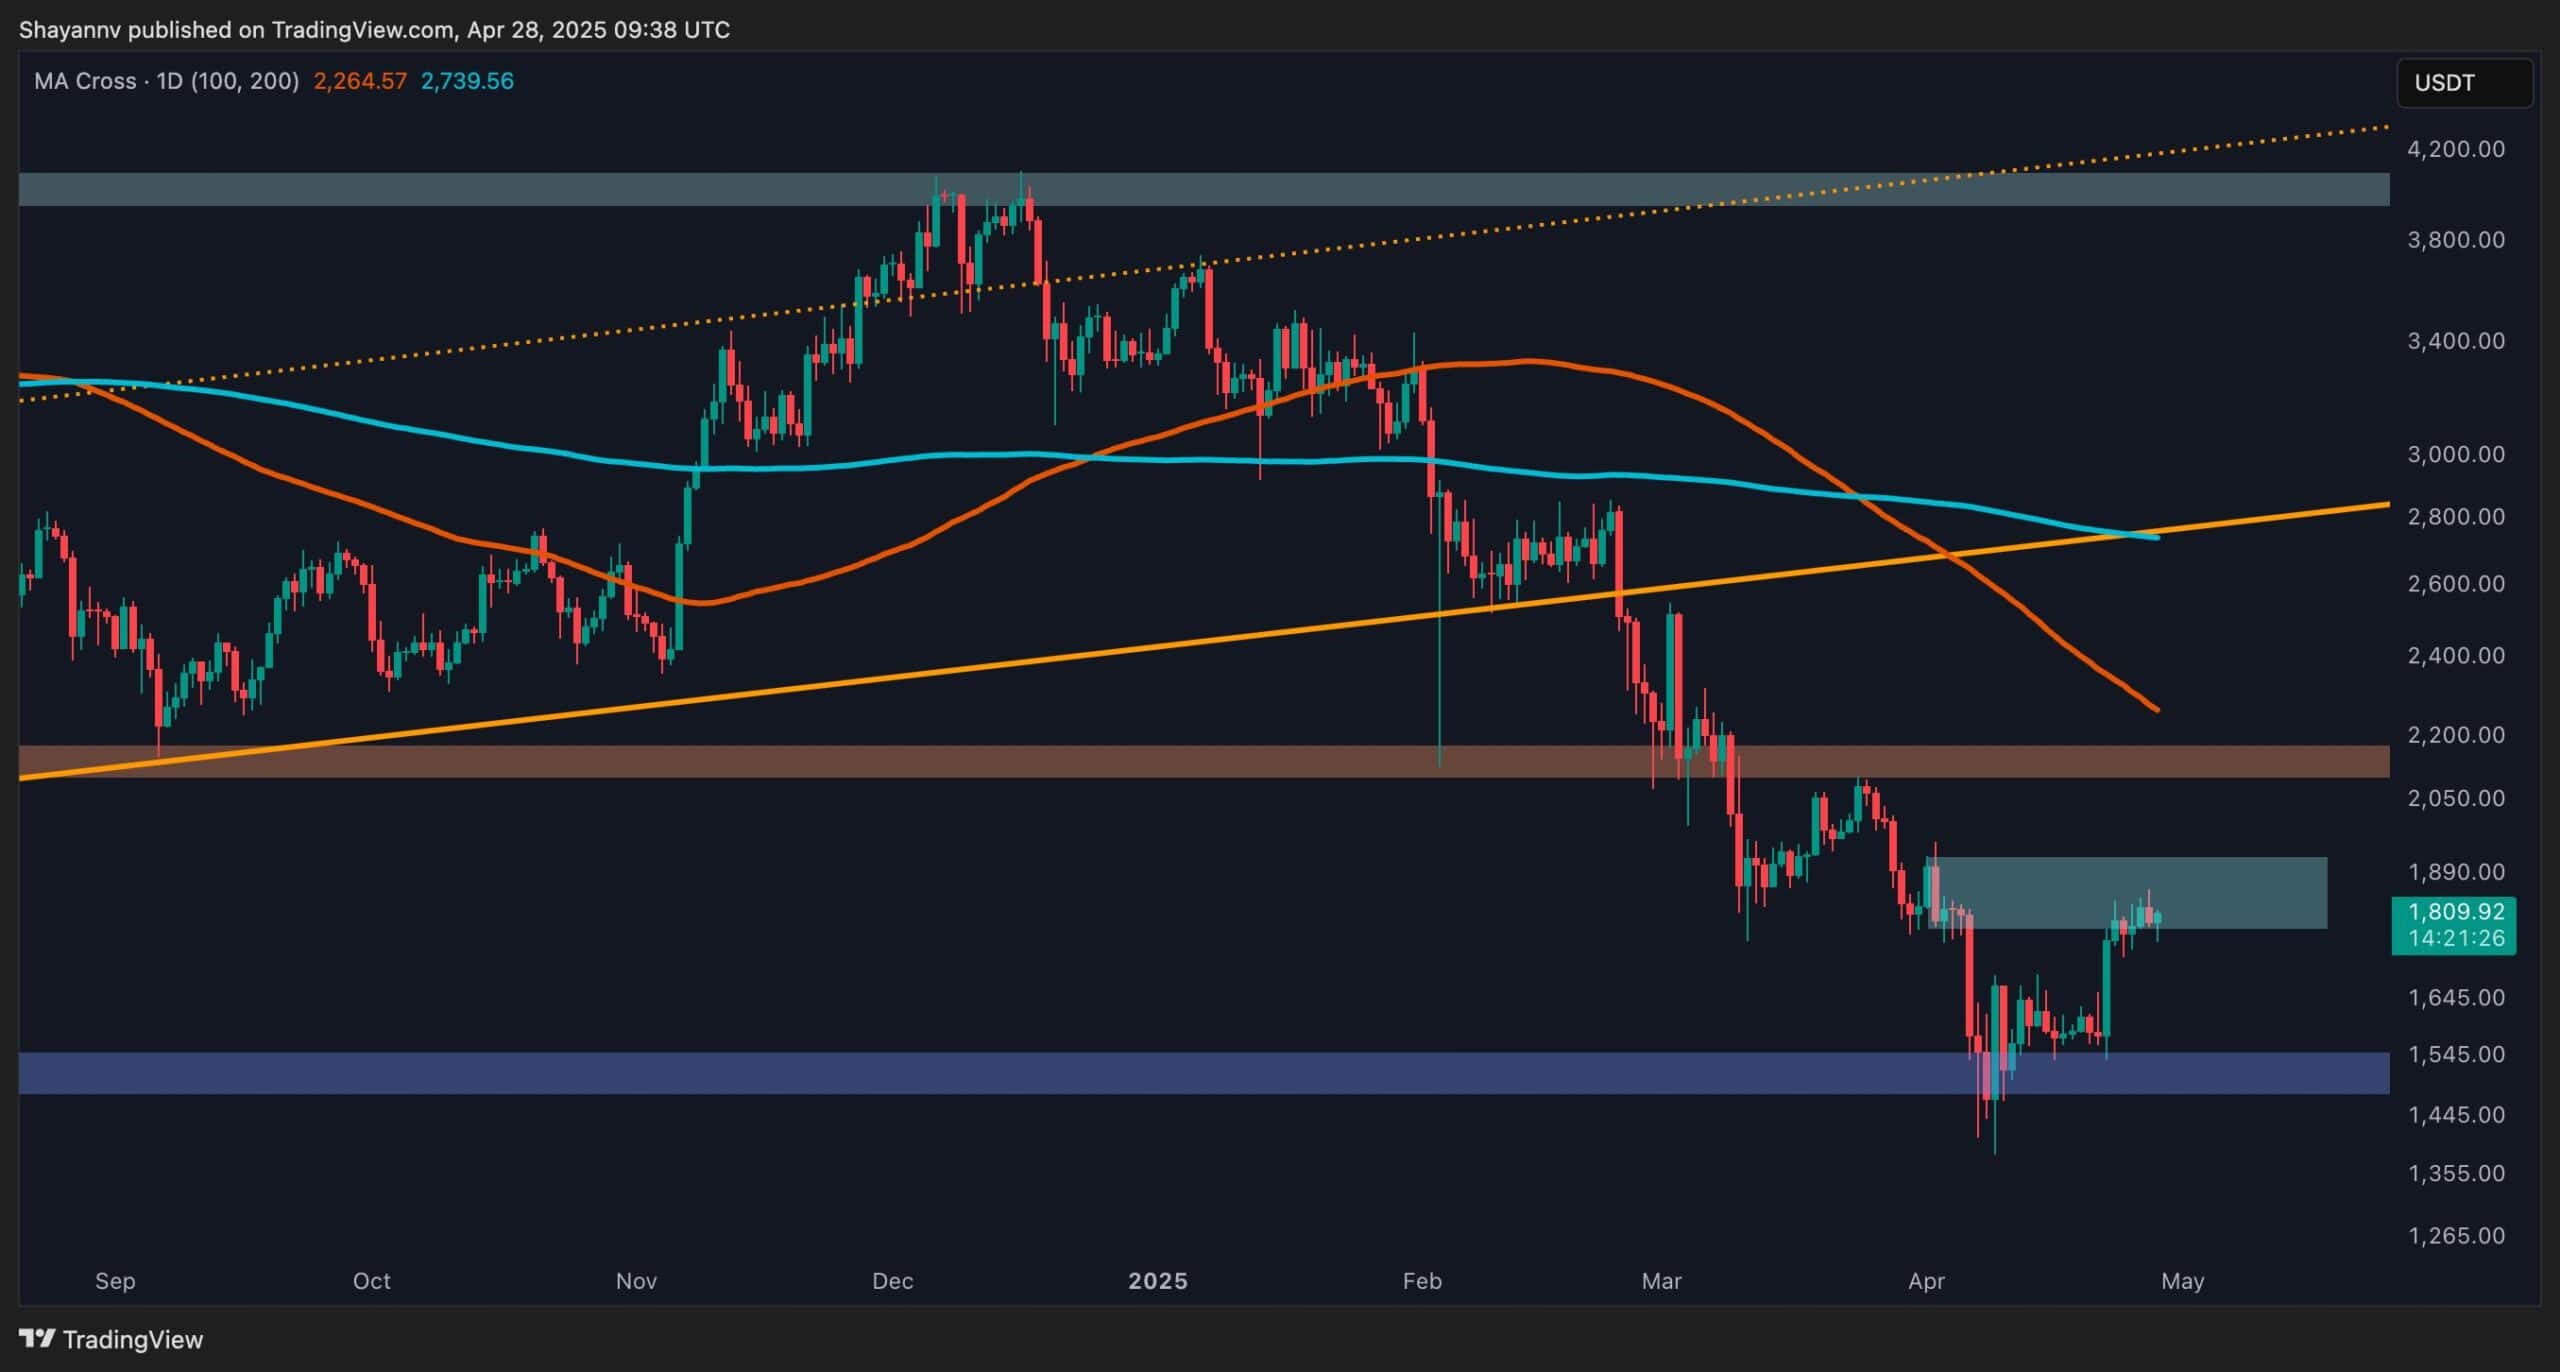
Daily Chart: Descending Trendline Test Underway
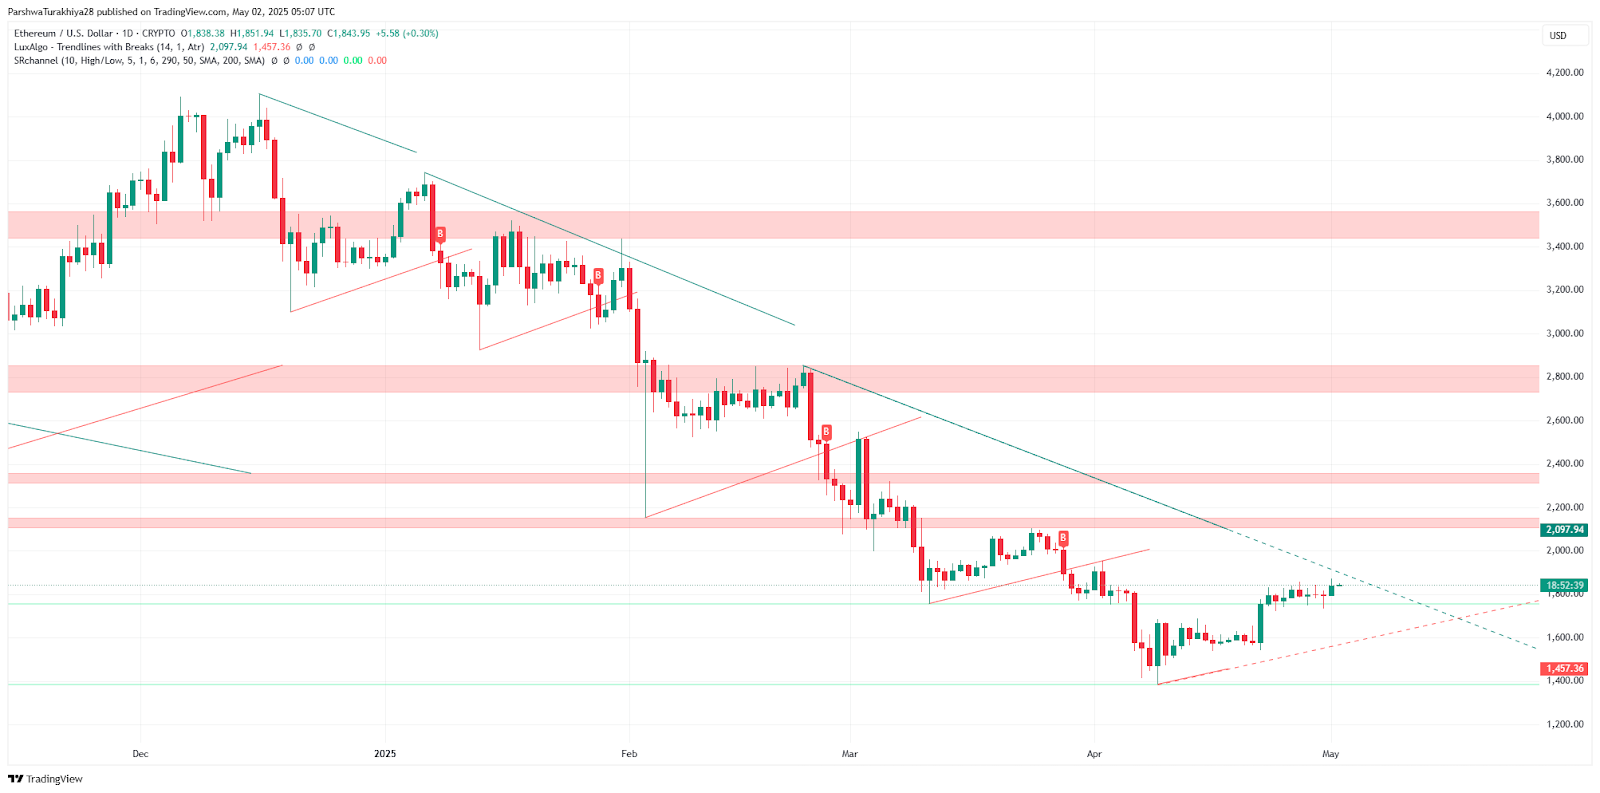
Ethereum is now attempting to break out of a long-standing descending trendline that stretches from February. The price recently pushed into the $1,850–$1,870 resistance band but has yet to register a decisive breakout.
So far, ETH is showing higher lows, but remains capped by horizontal and diagonal resistance.
4-hour Chart: Local Breakout, but Retest Crucial
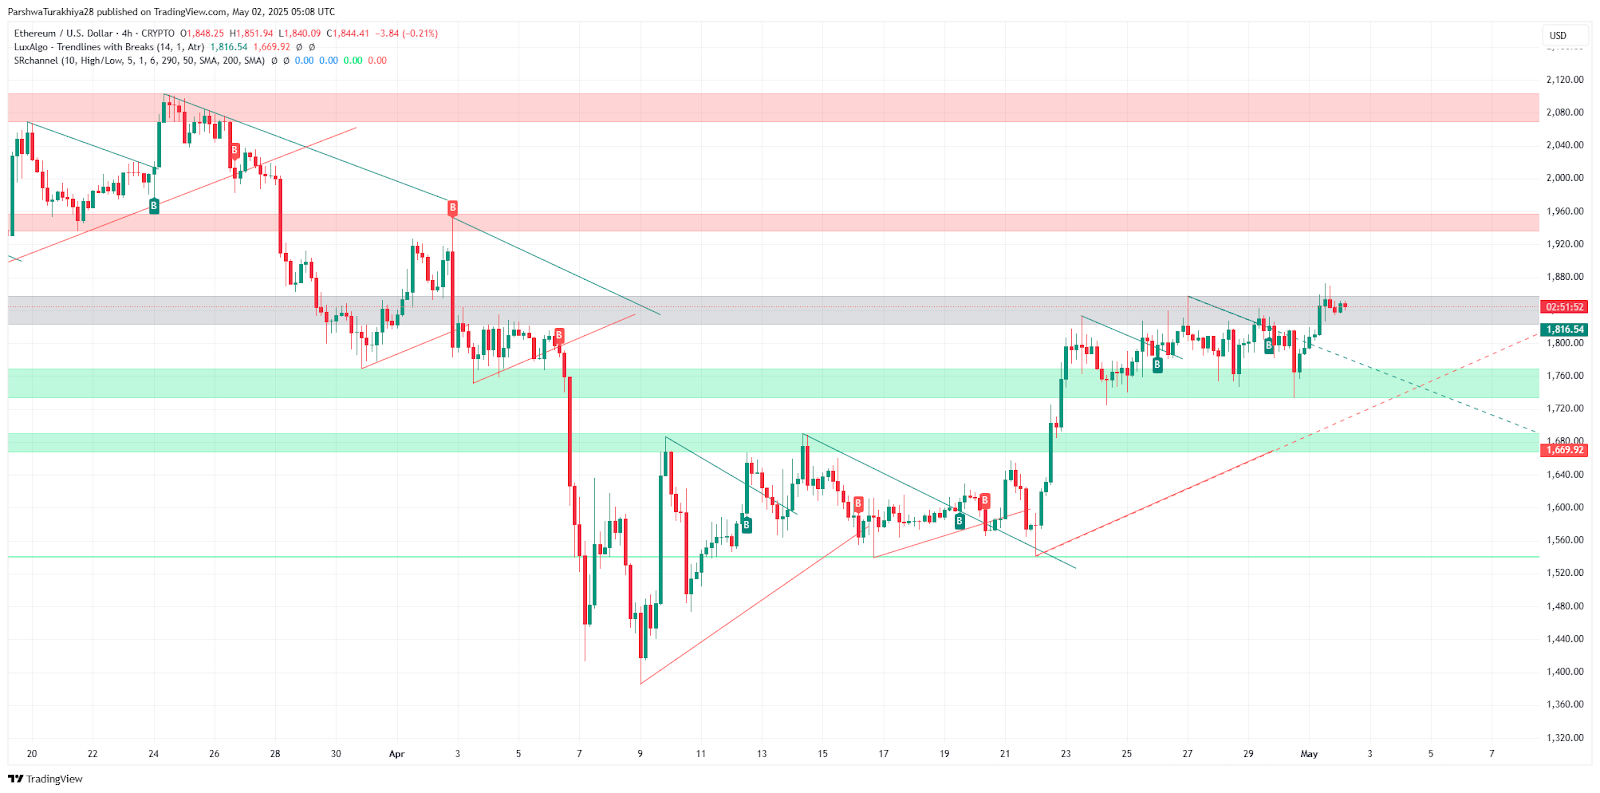
On the 4-hour chart, Ethereum has broken above a short-term consolidation pattern, pushing above the $1,820 neckline. However, sellers have quickly emerged near $1,860, signaling that ETH may require a retest of support to build further momentum.
The price action shows potential, but Ethereum must hold above the EMA cluster to continue upward.
EMA and RSI analysis (4H): Bullish Momentum Building
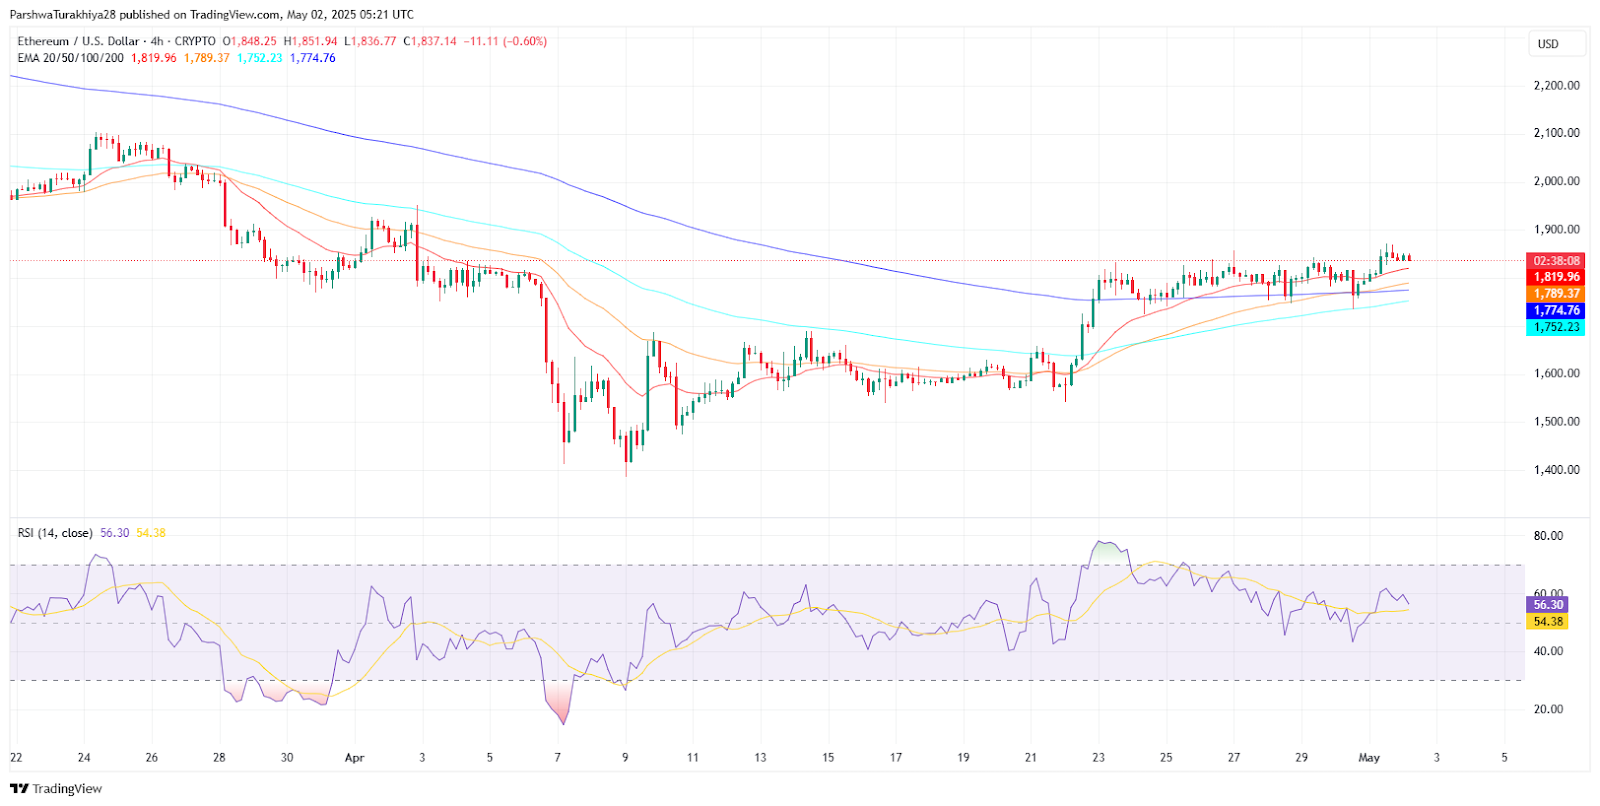
ETH is currently trading above all key EMAs—20, 50, 100, and 200—which is a strong signal of trend recovery on the 4-hour chart.
Support EMAs:
This EMA alignment confirms that ETH has a bullish bias in the short term. RSI is currently near 60, showing rising momentum but not yet in overbought territory.
Bollinger Bands and MACD: Volatility Expanding
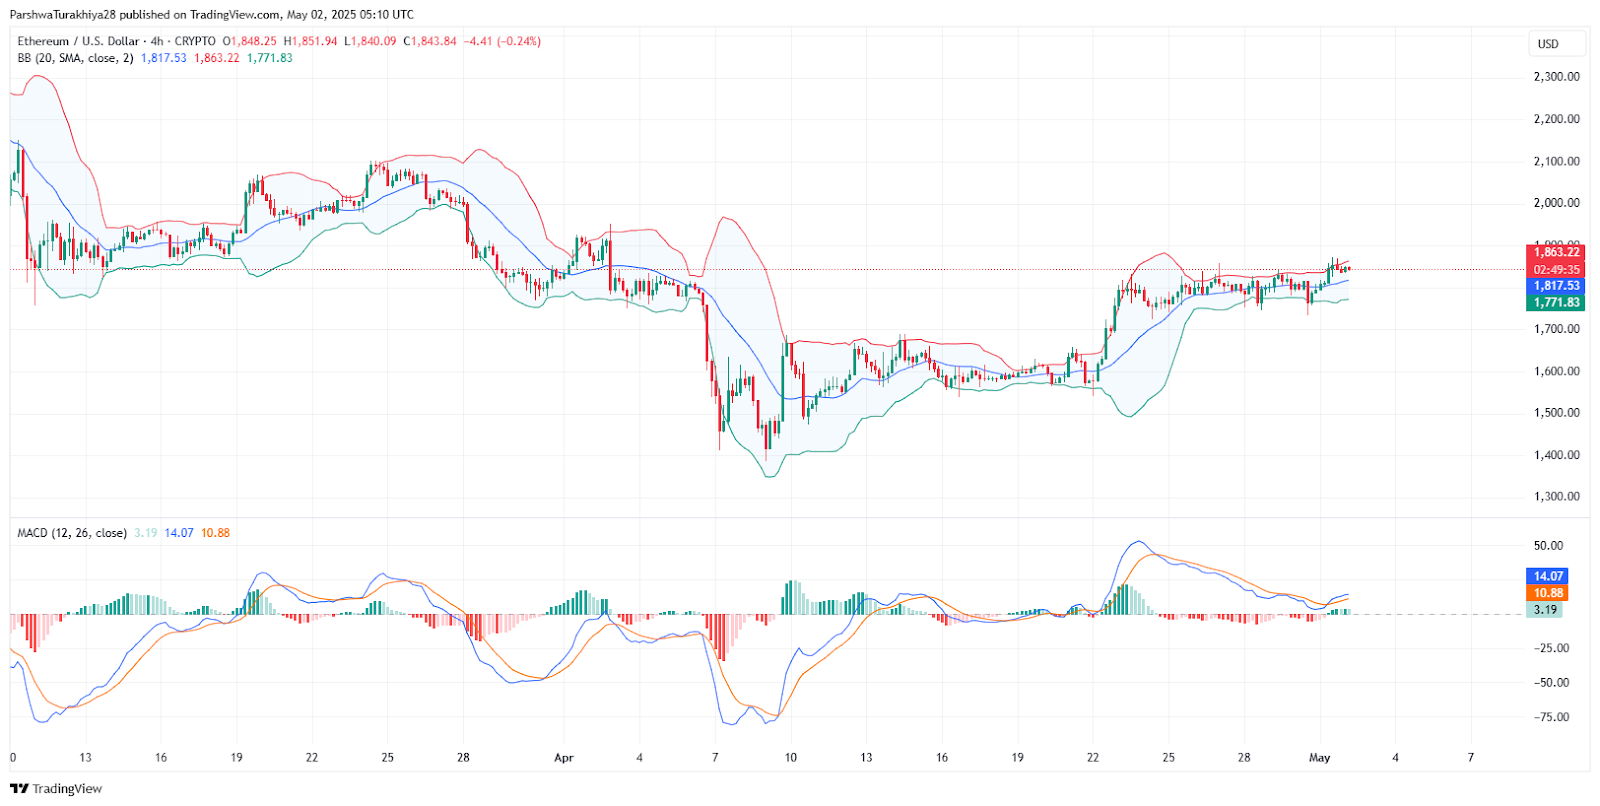
The Bollinger Bands on the 4-hour chart are widening, suggesting the possibility of a fresh directional move. ETH is hovering near the upper band, indicating continued buying interest.
If ETH can stay above the mid-band (around $1,810), a continuation toward $1,900 is likely.
Ethereum (ETH) Price Forecast Table: May 2025
| Price Scenario | Min Price | Avg Price | Max Price |
| Bullish breakout | $1,800 | $2,000 | $2,300 |
| Bearish breakdown | $1,450 | $1,600 | $1,780 |
| Range-bound trend | $1,700 | $1,840 | $1,900 |
Ethereum (ETH) Outlook for May 2025: Key Breakout Test Ahead
Ethereum stands at a crucial inflection point as it tries to break a multi-month trendline while holding major weekly support. The following outcomes are possible:
Bullish case:
If ETH can break above $1,880 and sustain above $1,900, the next targets would be $2,100 and potentially $2,300. This would confirm a bottom and attract more buyers, especially if the broader crypto market supports the rally.
Bearish risk:
Failure to hold the $1,750–$1,770 support zone could push ETH back toward $1,600 or even $1,450, particularly if volume dries up and macro sentiment turns negative.
Neutral base case:
Without a breakout or breakdown, Ethereum is likely to trade in a range between $1,750 and $1,900. Traders should look for confirmation from volume and momentum indicators before betting on a direction.


No comments yet