


Bitcoin is testing a crucial resistance level, breaking its downtrend as on-chain and technical data signal a potential market reset.
Notably, Bitcoin’s recent price action has hovered between $92,000 and $96,000 this week, exhibiting a gradual upward slope after a period of range-bound movement. Despite short-lived dips—particularly around April 28—the asset has steadily recovered, above $95,000 by May 1.
However, technical and on-chain indicators suggest a deeper transformation underway in Bitcoin’s market structure. Analytic platforms are now pointing to a potential shift in the broader trend, as multiple metrics show signs of renewed strength and market resets.
Key Resistance Levels Identified
Notably, Glassnode has confirmed this outlook, noting how Bitcoin has broken above its downtrend line and is testing resistance between $93,000 and $95,000. This price band also marks the lower boundary of a broader consolidation range observed between November 2024 and February 2025.
#Bitcoin is testing key resistance at $93K–$95K, breaking its downtrend and forming a higher high. On-chain and technical signals show a market at a turning point. Can the rally hold? Read the full analysis in the latest Week On-Chain: https://t.co/WHs4ymw3CL pic.twitter.com/j9HwiYzqab
— glassnode (@glassnode) April 30, 2025
Currently, the asset is now trading above both its 111-day moving average (111DMA) at $91,300 and the Short-Term Holder (STH) cost basis at $93,200. Historically, maintaining levels above these indicators has marked the difference between bullish from bearish phases.
Glassnode’s data shows that Bitcoin spent 56 out of the past 90 days below these levels, highlighting the duration of investor ‘time pain’ during the recent drawdown.
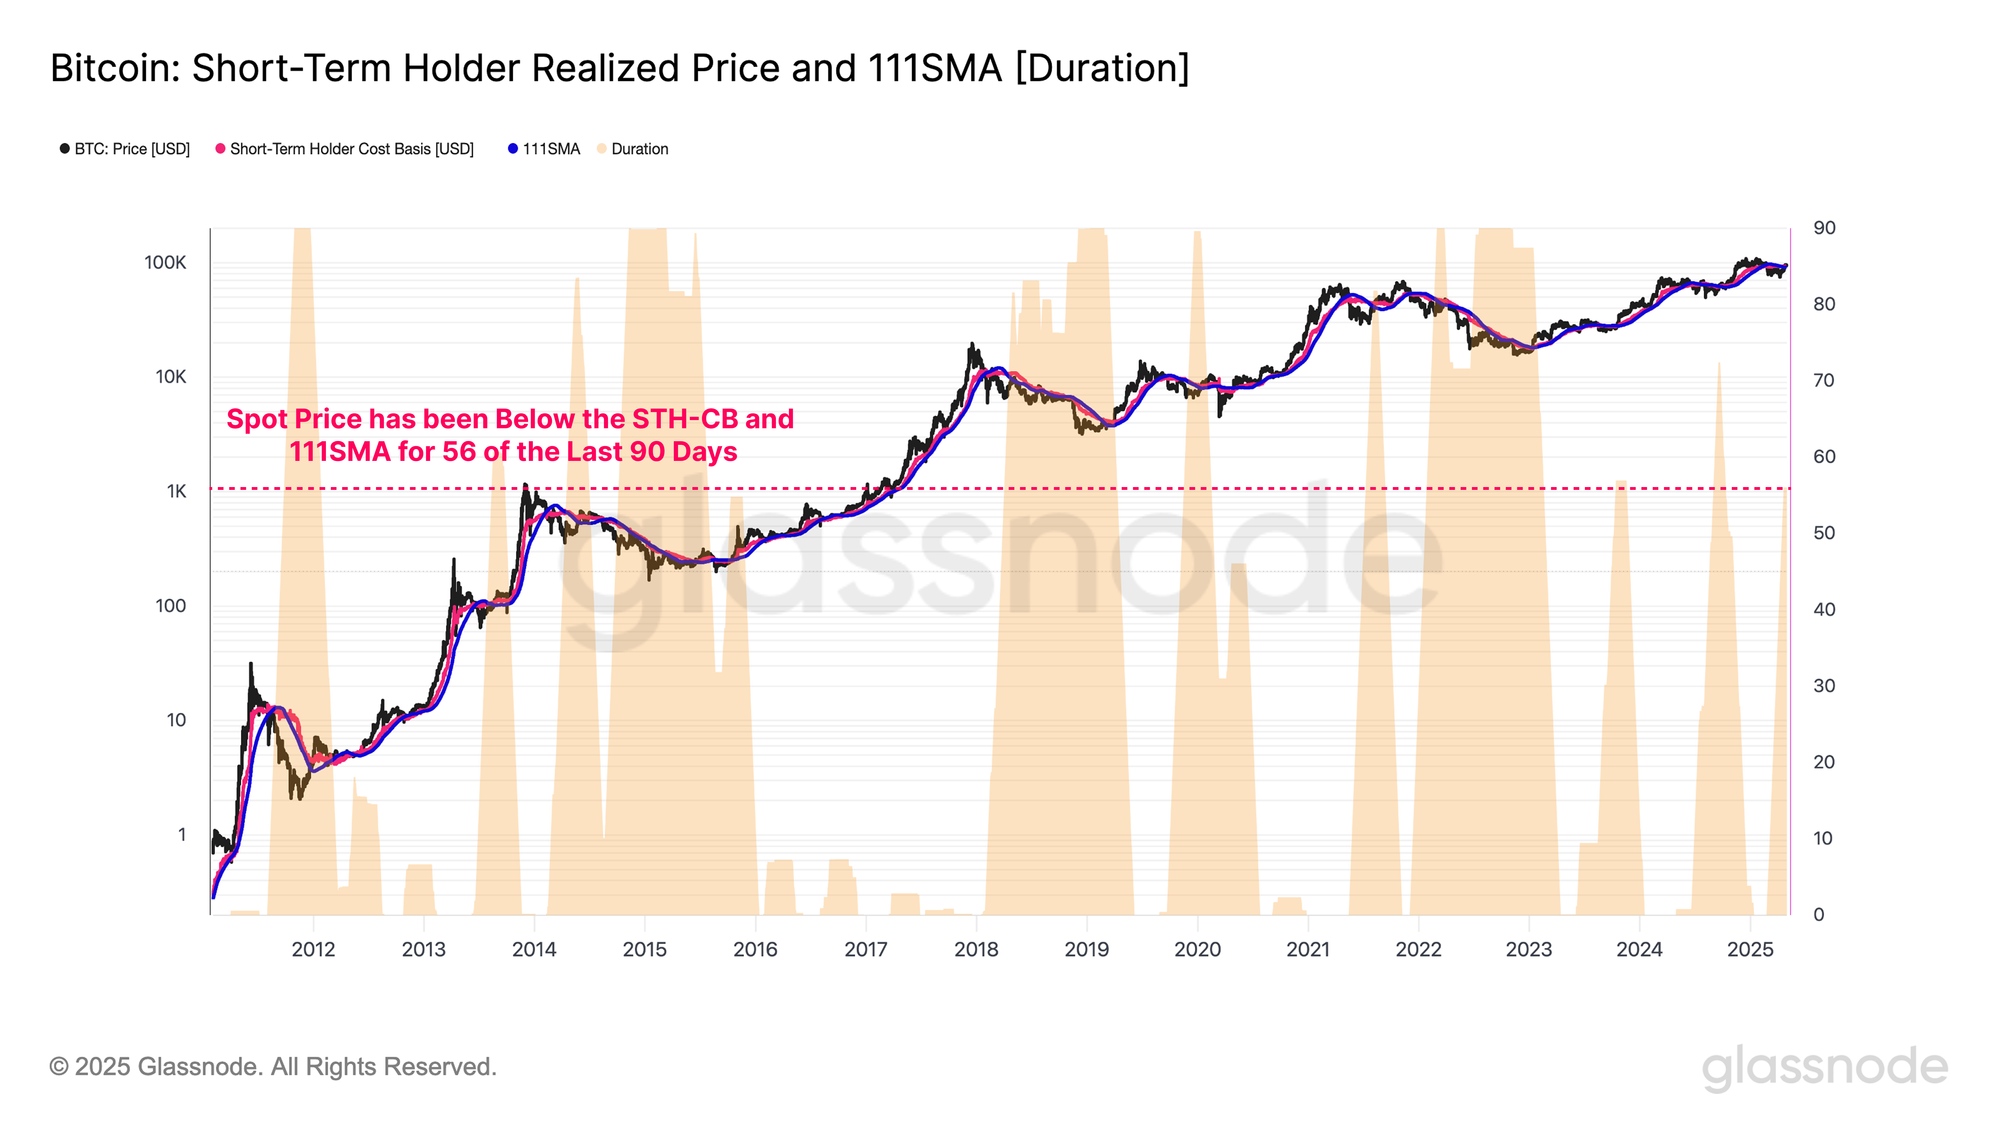
However, with the current breakout, the market appears to be exiting this zone of financial stress. This development suggests a potential reduction in realized losses, especially as price continues to consolidate within this critical band.
Momentum Indicators Show Recovery
Meanwhile, Glassnode provided further insight by segmenting Short-Term Holders into sub-groups based on holding duration. This cost-basis ribbon model reveals that investors holding Bitcoin for over one month have now moved into a profitable position.
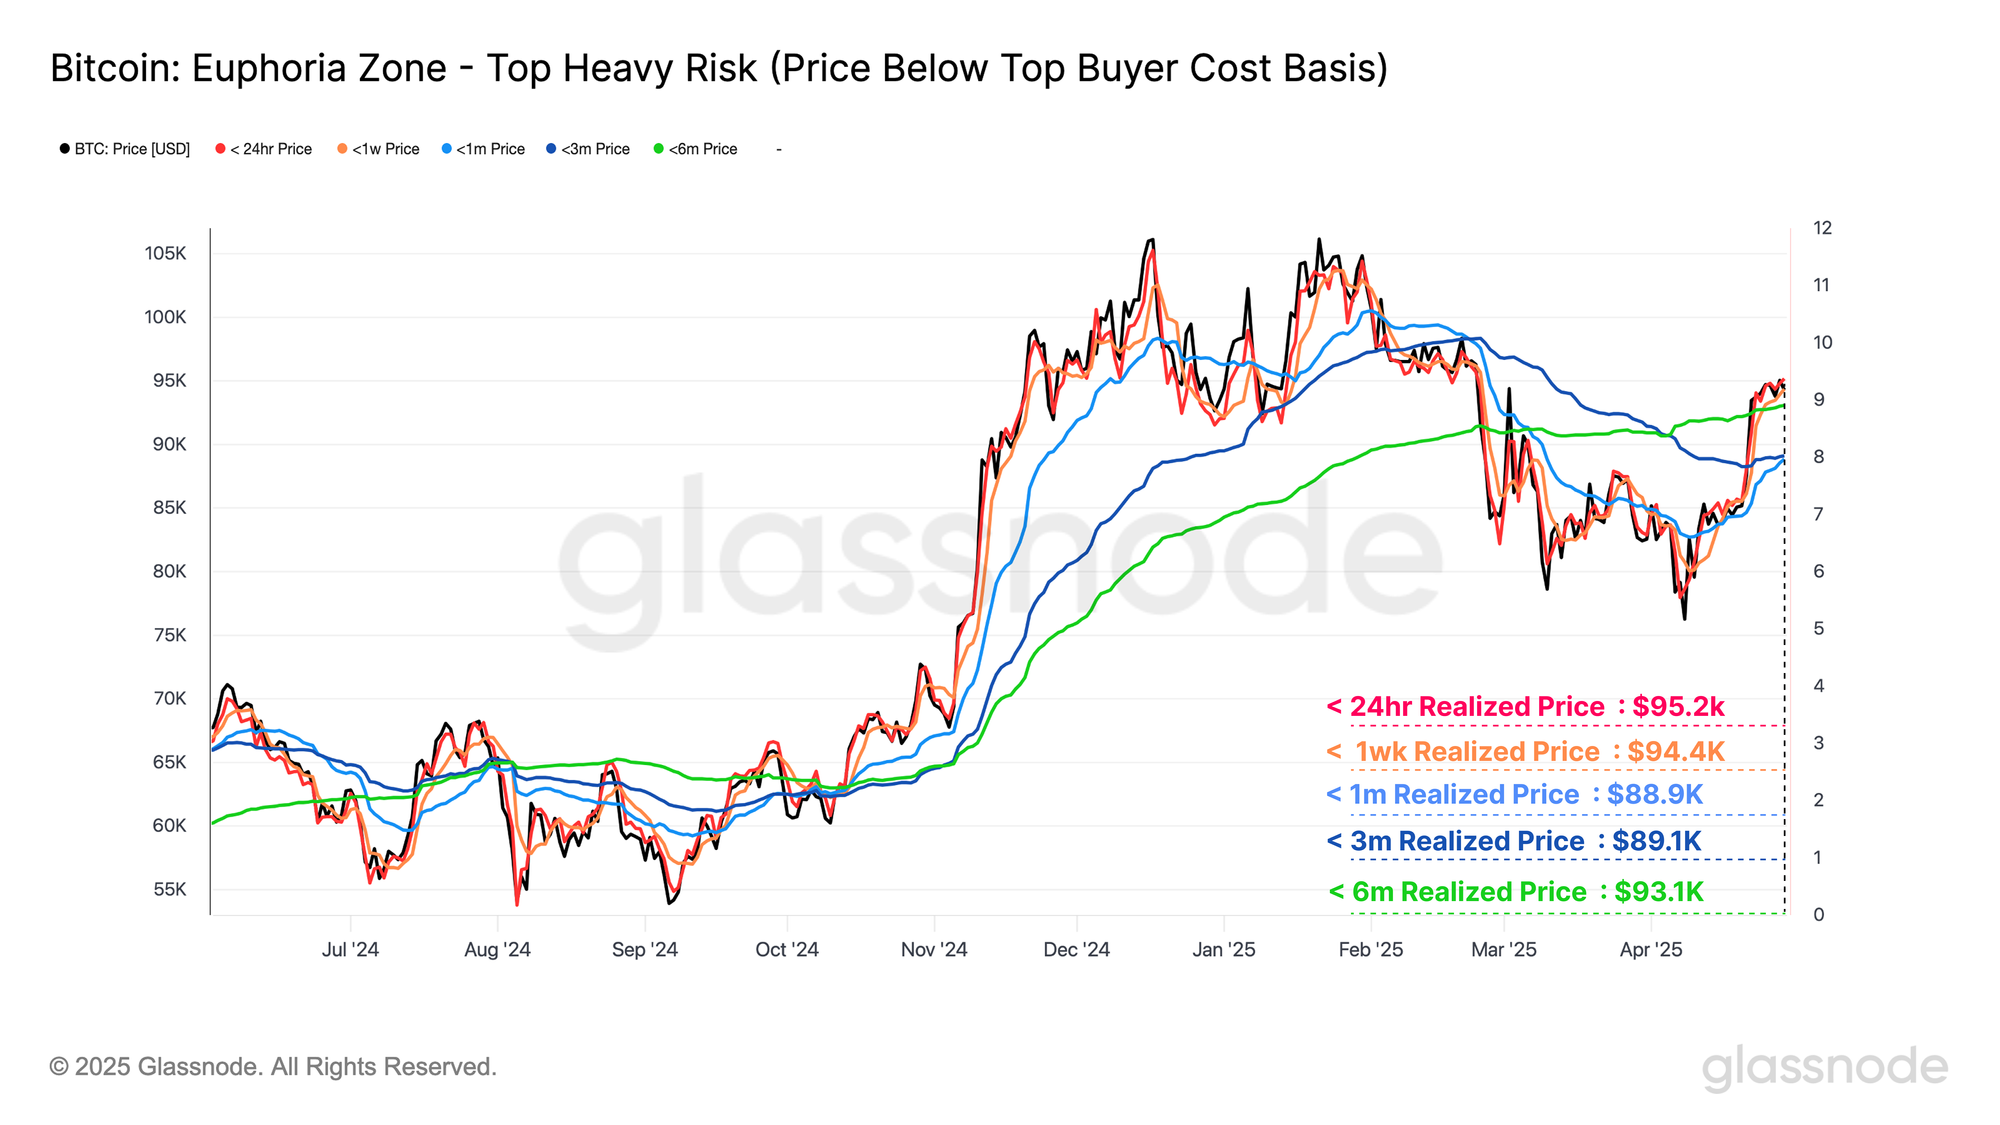
As a result, the market has seen a marked decline in financial pressure among this group. Per Glassnode, if sustained, this momentum could continue to reduce volatility stemming from investor capitulation.
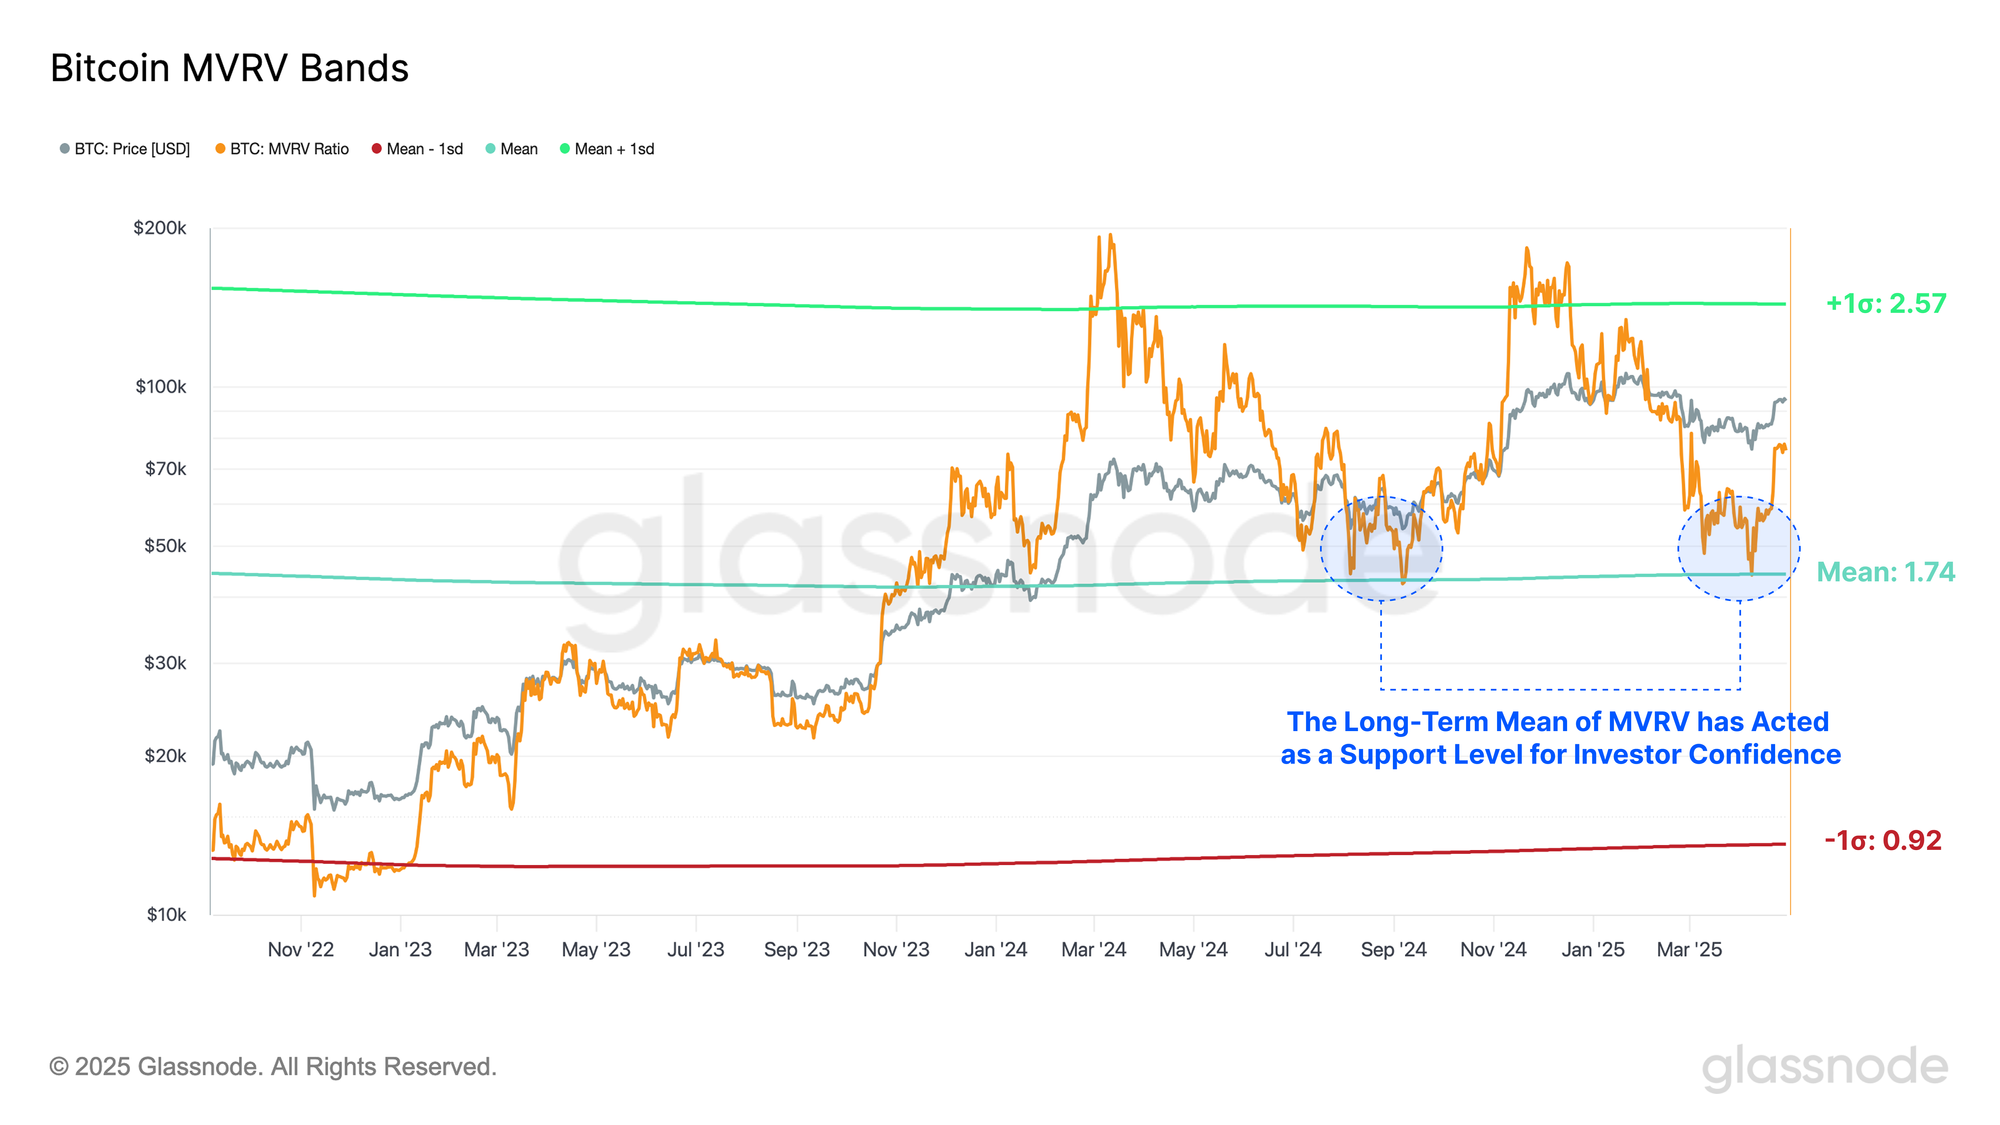
In parallel, the MVRV Ratio, which tracks unrealized profit or loss, has reverted to its long-term mean of 1.74. A similar pattern was observed during the previous consolidation phase in mid-2024. Notably, this reversion often serves as a base level for investor confidence.
Other metrics such as the circulating supply, spending domains, and the SOPR metric also point to a turning point for the largest cryptocurrency.
Market Reset, Not Peak Euphoria
Elsewhere, data from CryptoQuant supports the profitability thesis. As of April 29, 91% of Bitcoin’s circulating supply was in profit, an increase from levels observed during the April correction.
CryptoQuant’s verified analyst Darkfost identified this rise as a sign of market strength. During earlier drawdowns, profit levels dropped near 75%, a threshold that often triggers broader sell-offs.
Despite the current profitability level exceeding 90%, which Darkfost links to the euphoria stage of a typical market cycle, no immediate pressure to sell has emerged.


No comments yet