


Fundstrat’s head of research Tom Lee says there are four big signs backing up the idea that the stock market is in the midst of a bullish reversal.
In a new video update on Fundstrat’s YouTube channel, Lee starts off by noting that on April 24th, a Zweig breadth thrust was triggered on the S&P 500 index.
The Zweig breadth thrust is an indicator that attempts to detect the early stages of a potential bull run by dividing the 10-day moving average of the number of advancing stocks by the total number of stocks.
Lee says that the Zweig breadth thrust has nearly always signaled imminent stock market rallies.
“That has happened 11 times since 1978 and notably, one month, six months and 12 months later, stock markets are always up. And this was triggered on April 24.”
Secondly, Lee notes that the high yield options adjusted spreads (OaS) retraced 50% of its widening on April 23rd. A shrinking of credit spreads – the difference in yield between riskier junk bonds and “risk-free” government bonds – typically signals stability and healthy investor risk appetite.
“That’s a positive development because we are now walking back from a recession risk. If high yield spreads had gone from 500 [basis points] to 1,000, a recession was guaranteed, but instead it’s reversed almost all the widening back to even levels before April 2nd.”
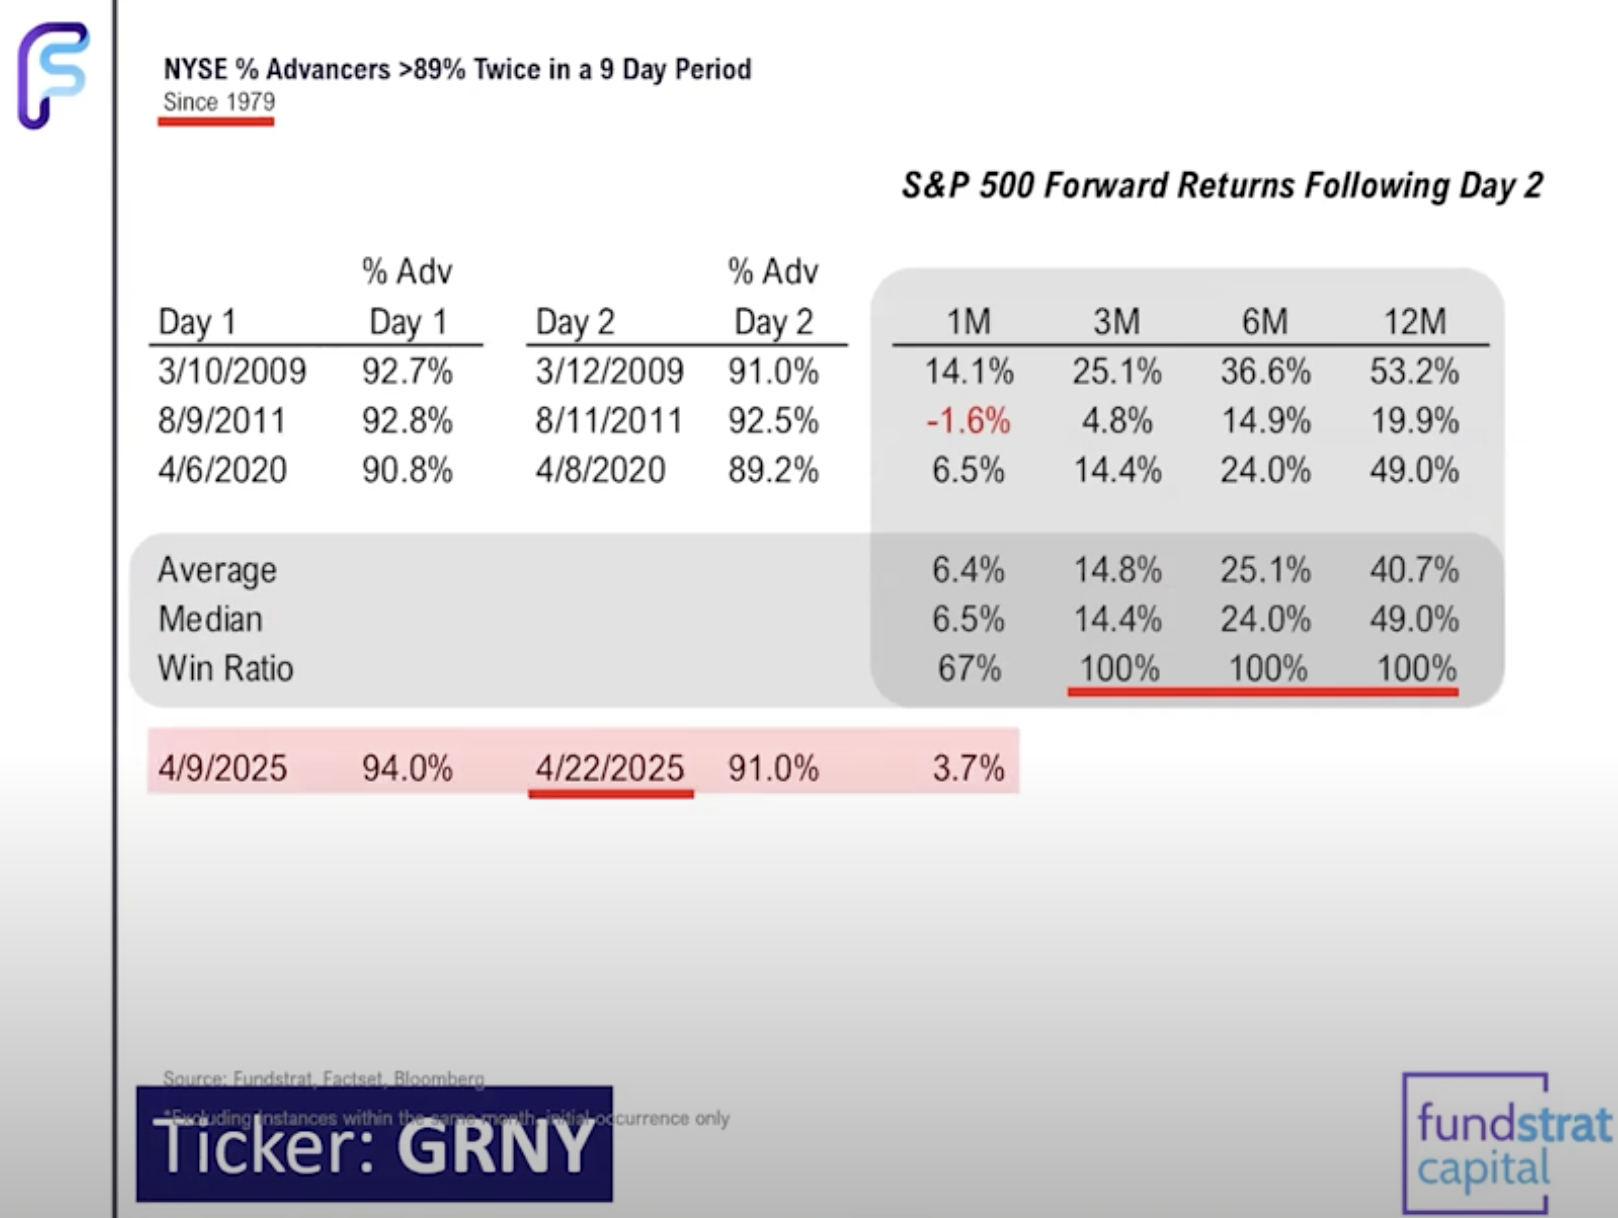
Lee also says that the S&P 500 saw two straight days where 90% of the S&P 500 stocks rallied, an event that has historically led to further upside.
“That means that stocks, within a couple of days apart, had posted two days where the advancing gains were 90% or more. As you can see here, three times since 1979, stocks are higher three, six and 12 months later.”
Lastly, the investor takes note of the volatility index (VIX) – a measure of market volatility based on data from the Chicago Board Options Exchange – closing below the 31 level.
According to Lee, the VIX is now signaling a drop off in future volatility and likely strength for equities.
Follow us on X, Facebook and Telegram
Don't Miss a Beat – Subscribe to get email alerts delivered directly to your inbox
Check Price Action
Surf The Daily Hodl Mix
Generated Image: Midjourney


No comments yet