


Author: Yashu Gola, CoinTelegraph; compiled by: Wuzhu,
summary
BTC clearing levels, on-chain data and chart settings all converge at the $100,000 target.
The sharp increase in profitability indicates that market confidence has rebounded.
BTC is flashing multiple technologies and on-chain signals indicating a possible rebound to $100,000 by May. The following five charts indicate a breakthrough in the near future.
BTC double bottom suggests target price of $100,600
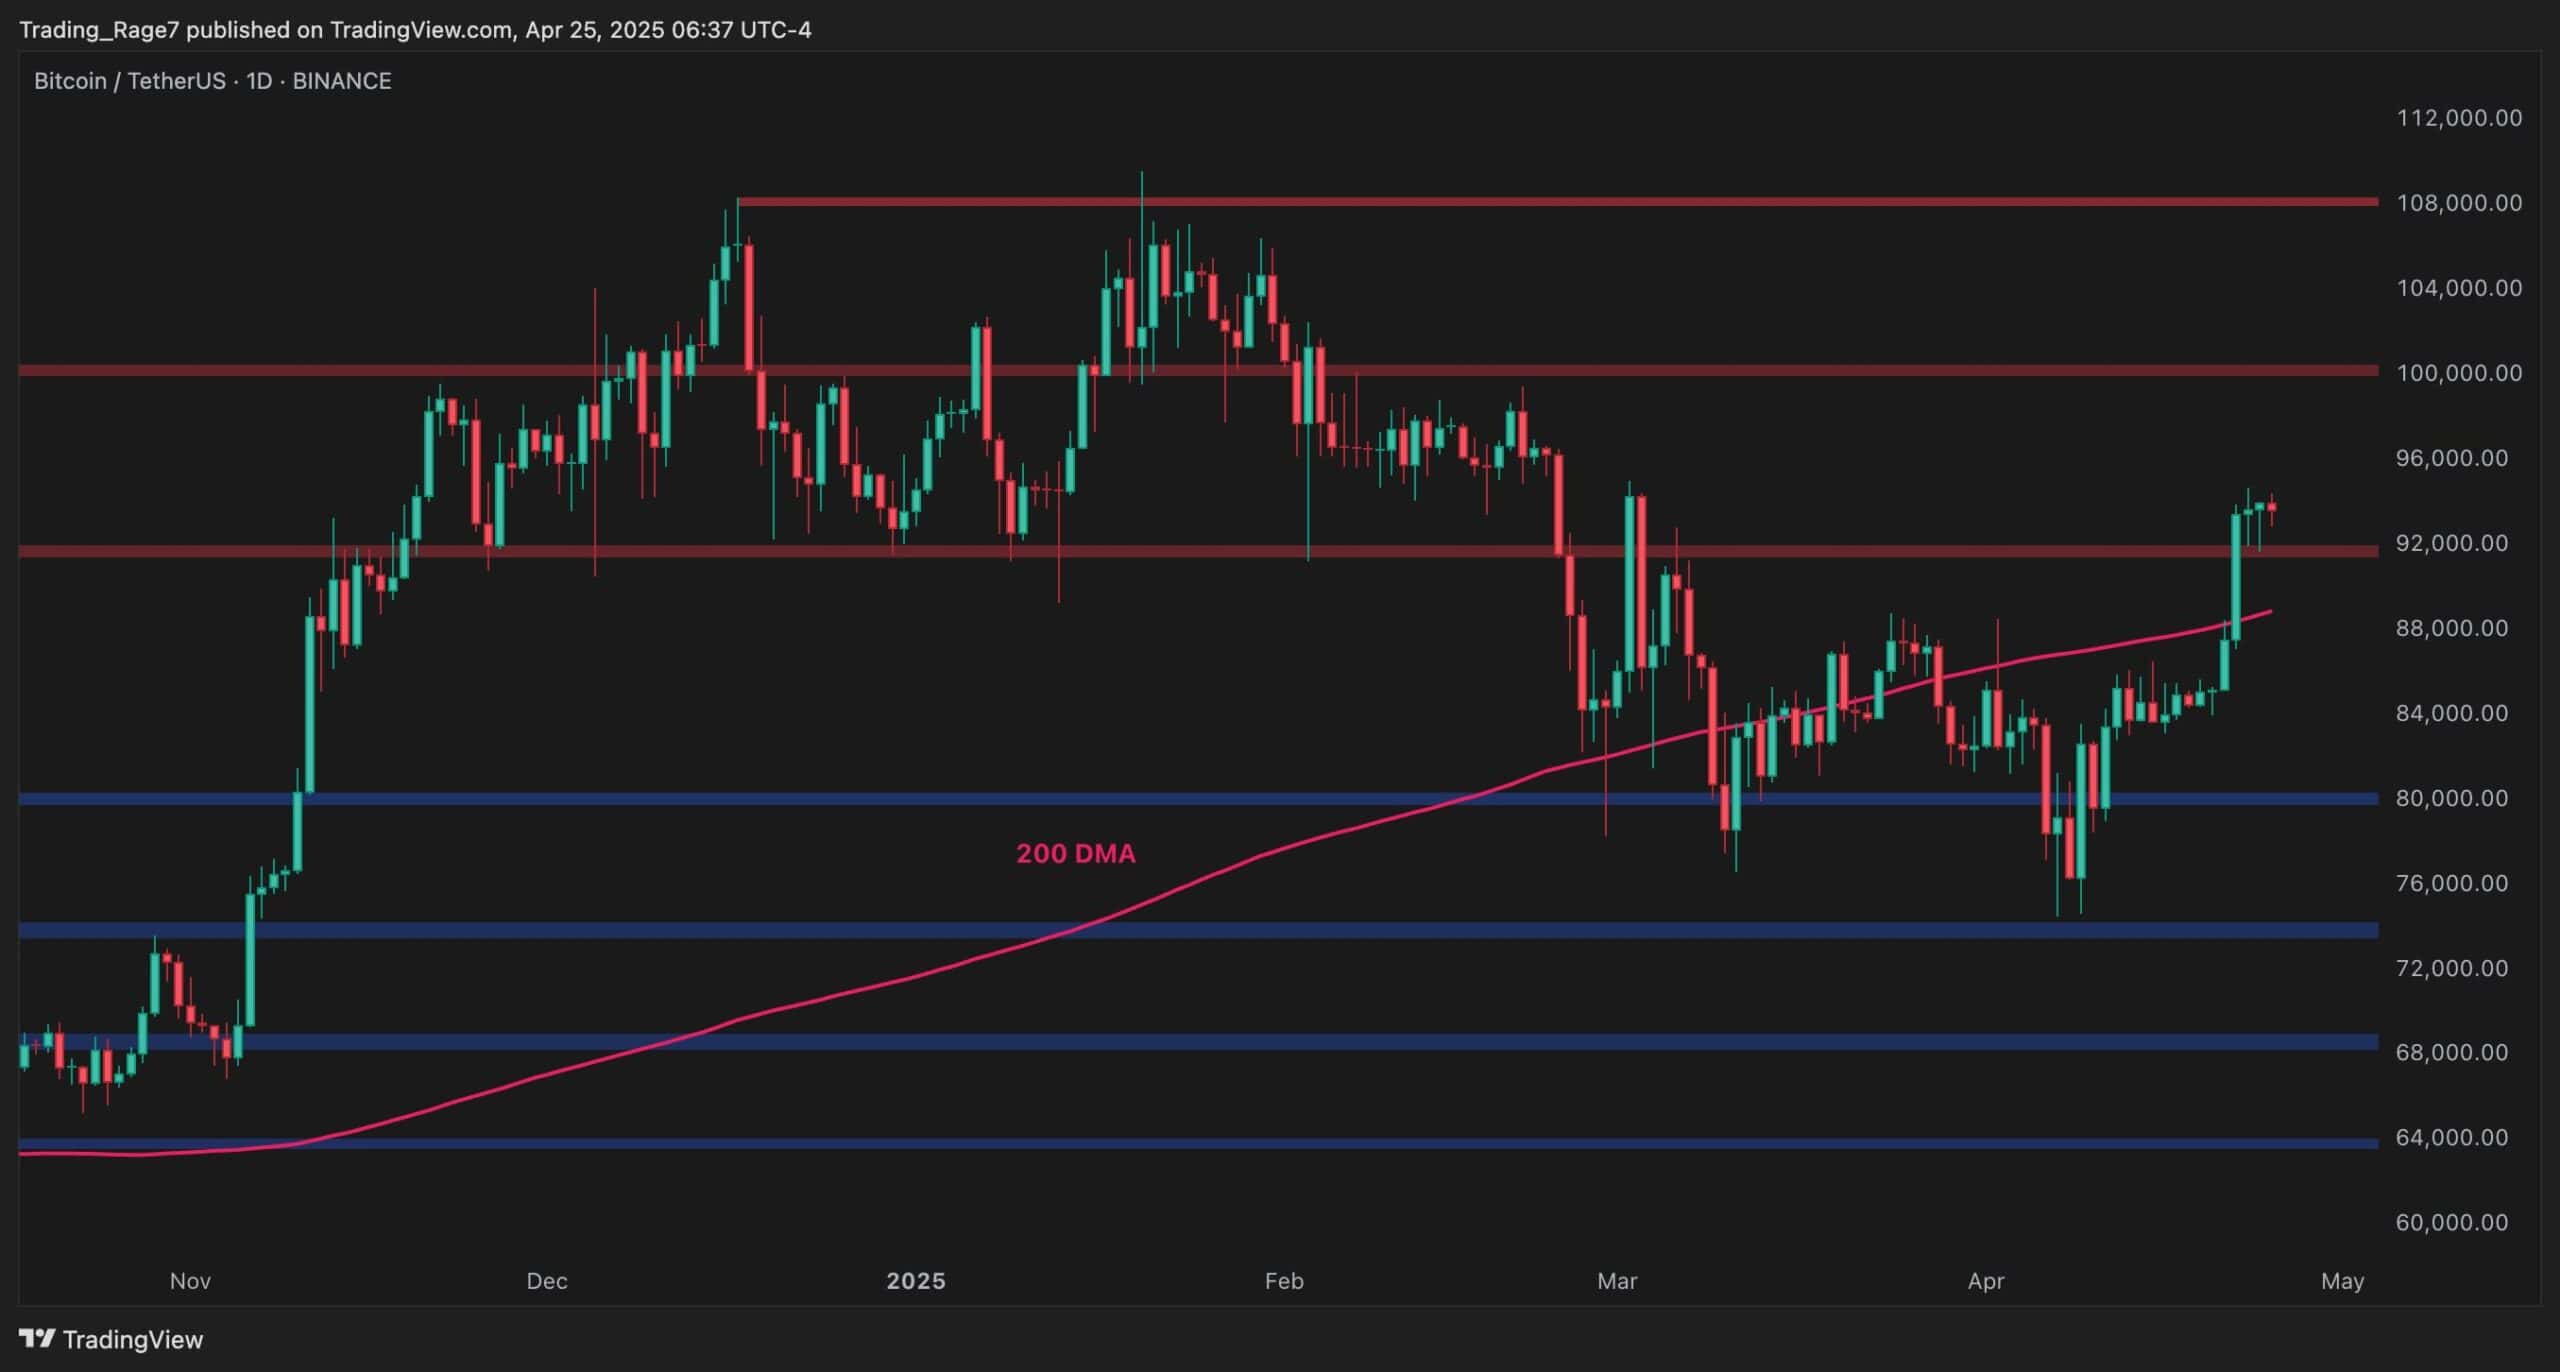
BTC's daily chart forms a typical double bottom, confirming a breakout of the neckline resistance at $87,643. It is expected to reach $100,575 or above.
BTC/USD Daily Price Chart. Source: TradingView
Momentum indicators such as the Relative Strength Index (RSI) support this argument, maintaining the bullish zone and having greater room for expansion. Meanwhile, the 50-day and 200-day exponential moving averages (EMA) have been turned to support, providing additional tailwinds.
Trading volume remained stable after the breakout, indicating that buyers were still under control. This lays a solid foundation for Bitcoin to move towards $100,600.
Bull market targets six-digit BTC
Judging from the hourly chart, BTC consolidated within the bull pennant after a sharp rise. This pattern indicates a temporary hesitation before the next round of gains. The target price is around $100,900.
BTC/USD hourly price chart. Source: TradingView
The pennant shape formed after a sharp rise, indicating that the BTC price may fall first and then resume the upward trend. Despite the low volume, the structure is still intact and supported by a strong EMA permutation.
Breakthroughs through the trend line on the pennant could trigger a new upward momentum, attracting short-term traders and algorithms targeting integer breakthroughs.
Bitcoin’s downward wedge breakout target is $102,000
The three-day chart shows that the declining wedge breakout has been completed, with the price breaking through the key resistance zone near $94,000. The projected target is $102,270.
BTC/USD Three-day Price Chart. Source: TradingView
A downward wedge is usually a bullish reversal pattern, while a clear breakthrough in BTC to the upward trend line increases technical confidence. The price is also above the 50-3D EMA, which is a key trend signal.
Volume surged during the breakout period, indicating strong buyer confidence.
The $94,000-95,000 resistance level currently limits Bitcoin’s upside attempts. Breakthroughs beyond this level means BTC can quickly achieve its full-scale pace towards $100,000.
Large amount of short liquidation around $100,000
Clearing data show that there are a large number of short liquidations at the level of around $100,000. These positions are usually like magnets, pulling prices towards them as market makers seek liquidity.
BTC/USDT three-month liquidation heat map. Source: CoinGlass
If BTC continues to climb, it will put pressure on the bears and they may be forced to exit, triggering a large amount of payouts.
Liquidity charts are usually pre-priced. With the activity density approaching six digits, the path with the least resistance appears to be upward in the short term.
Bitcoin's profitability improves after breakthrough
According to Glassnode, 87.3% of Bitcoin circulating supply was profitable as of April 23, up from 82.7% of the last time BTC traded near $94,000 in early March.
This growth suggests that a large portion of Bitcoin supply changed hands at lower levels during the adjustment period in March, reflecting a new wave of accumulation.
BTC supply volume profit percentage. Source: Glassnode
Historically, when the percentage of profit supply remains above 90% for a long time, the market tends to enter an euphoric stage. As profitability is now approaching this threshold, bullish sentiment continues to increase.
Combining the bullish chart structure and concentrated short-term liquidity, BTC is still likely to reach $100,000 in May.


No comments yet