


Have you ever stared at the wild swings of Bitcoin's candlestick chart, feeling like you’ve stumbled into a Morse code convention with terms like "breaking resistance" and "death cross" buzzing around? Don’t panic—this isn’t alien language! In the crypto world, technical analysis is the ultimate translator for retail investors, turning chaotic price movements into actionable market signals. But here’s the million-dollar question: Can it really help you navigate the rollercoaster of crypto trading? Let’s dive into the of technical analysis and uncover the essential tools even newbies can master!
Is Technical Analysis Useful in the Cryptocurrency Market?
Before answering this question, we need to understand what technical analysis is. Simply put, technical analysis is a method of predicting future price trends by studying the past and present behavior of the market. It's like a weather forecast. Although it can't be 100% accurate, it can provide us with some useful information to help us prepare in advance.
So, is technical analysis useful in the cryptocurrency market? The answer is yes, but it also has limitations.
On the useful side, technical analysis can help us identify market trends. Like other financial markets, the Bitcoin market also has stages of rising, falling, and consolidation. By analyzing price charts, we can discover the main market trends and then decide whether to buy, sell, or hold. For example, when the price shows an obvious upward trend, we can consider buying Bitcoin and wait for the price to rise further. On the contrary, when the price is in a downward trend, we can choose to sell or stay out of the market for the time being.
Technical analysis can also help us find the right trading opportunities. In the cryptocurrency market, timing is everything. By studying technical indicators, we can find the support and resistance levels of the price. The support level is like the "floor" of the price. When the price drops to this level, it often gets support and rebounds. The resistance level is like the "ceiling" of the price. When the price rises to this level, it may encounter resistance and fall back. By mastering these key levels, we can conduct trading operations at the right time and increase the probability of making a profit.
However, technical analysis is not a panacea. The cryptocurrency market is a highly complex and uncertain market, affected by various factors such as policies and regulations, market sentiment, and the operations of large institutions. These factors are often unpredictable and may cause sudden and significant price fluctuations, making the results of technical analysis invalid. Therefore, technical analysis can only be used as a reference for our investment decisions and cannot be completely relied on.
What Kinds of Technical Analysis Are There in the Cryptocurrency Market?
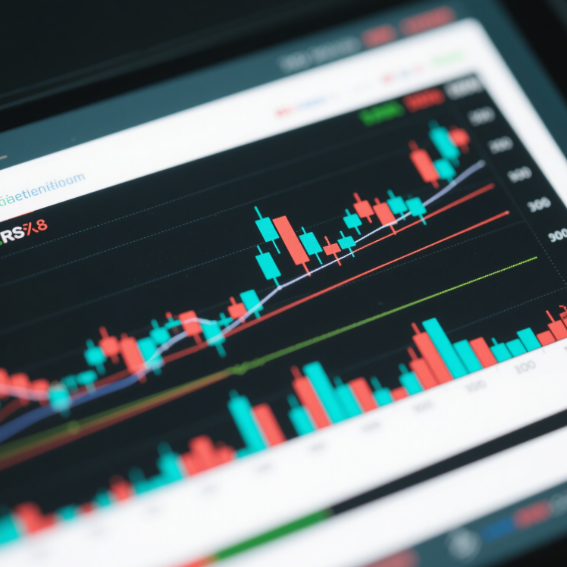
1. Candlestick Chart Analysis
The candlestick chart is one of the most commonly used technical analysis tools in the cryptocurrency market. It intuitively shows the price fluctuations by plotting the daily opening price, closing price, highest price, and lowest price. Different combinations of candlesticks can convey different market information. For example, a long bullish candlestick usually indicates that the bullish power in the market is strong, and the price may continue to rise. On the other hand, a long bearish candlestick indicates that the bearish power dominates, and the price may fall.
2. Moving Average Analysis
Moving average is a method of smoothing price data. It can help us filter out short - term price fluctuations and see the long - term market trend more clearly. Common moving averages include the 5 - day moving average, 10 - day moving average, and 20 - day moving average. When the short - term moving average crosses above the long - term moving average, it is called a "golden cross", which is usually a buying signal. Conversely, when the short - term moving average crosses below the long - term moving average, it is called a "death cross", which is a selling signal.
3. Relative Strength Index (RSI) Analysis
The Relative Strength Index is an indicator that measures the strength of buying and selling forces in the market. Its value ranges from 0 to 100. When the RSI value exceeds 70, it indicates that the market is in an overbought state, and the price may pull back. When the RSI value is below 30, it indicates that the market is in an oversold state, and the price may rebound. By observing the RSI indicator, we can judge the trading opportunities in the market.
In conclusion, technical analysis in the cryptocurrency market is a very useful tool for beginners, but we should view it correctly and not blindly believe in it. In the investment process, we also need to combine fundamental analysis, risk management, and other methods to move forward steadily in this market full of risks and opportunities. I hope today's sharing can be helpful to you all. Wish you all good luck in your cryptocurrency investments!


No comments yet