


作者:加密追踪者
While XRP continues to record declines, its multi-month falling wedge may present one of the best buying opportunities.
XRP remains under selling pressure, with its price down 28.49% since the start of 2026. This extended drop has kept investors cautious, but data suggests the resulting falling wedge structure could present an attractive buying setup, targeting $8.3.
Key Points
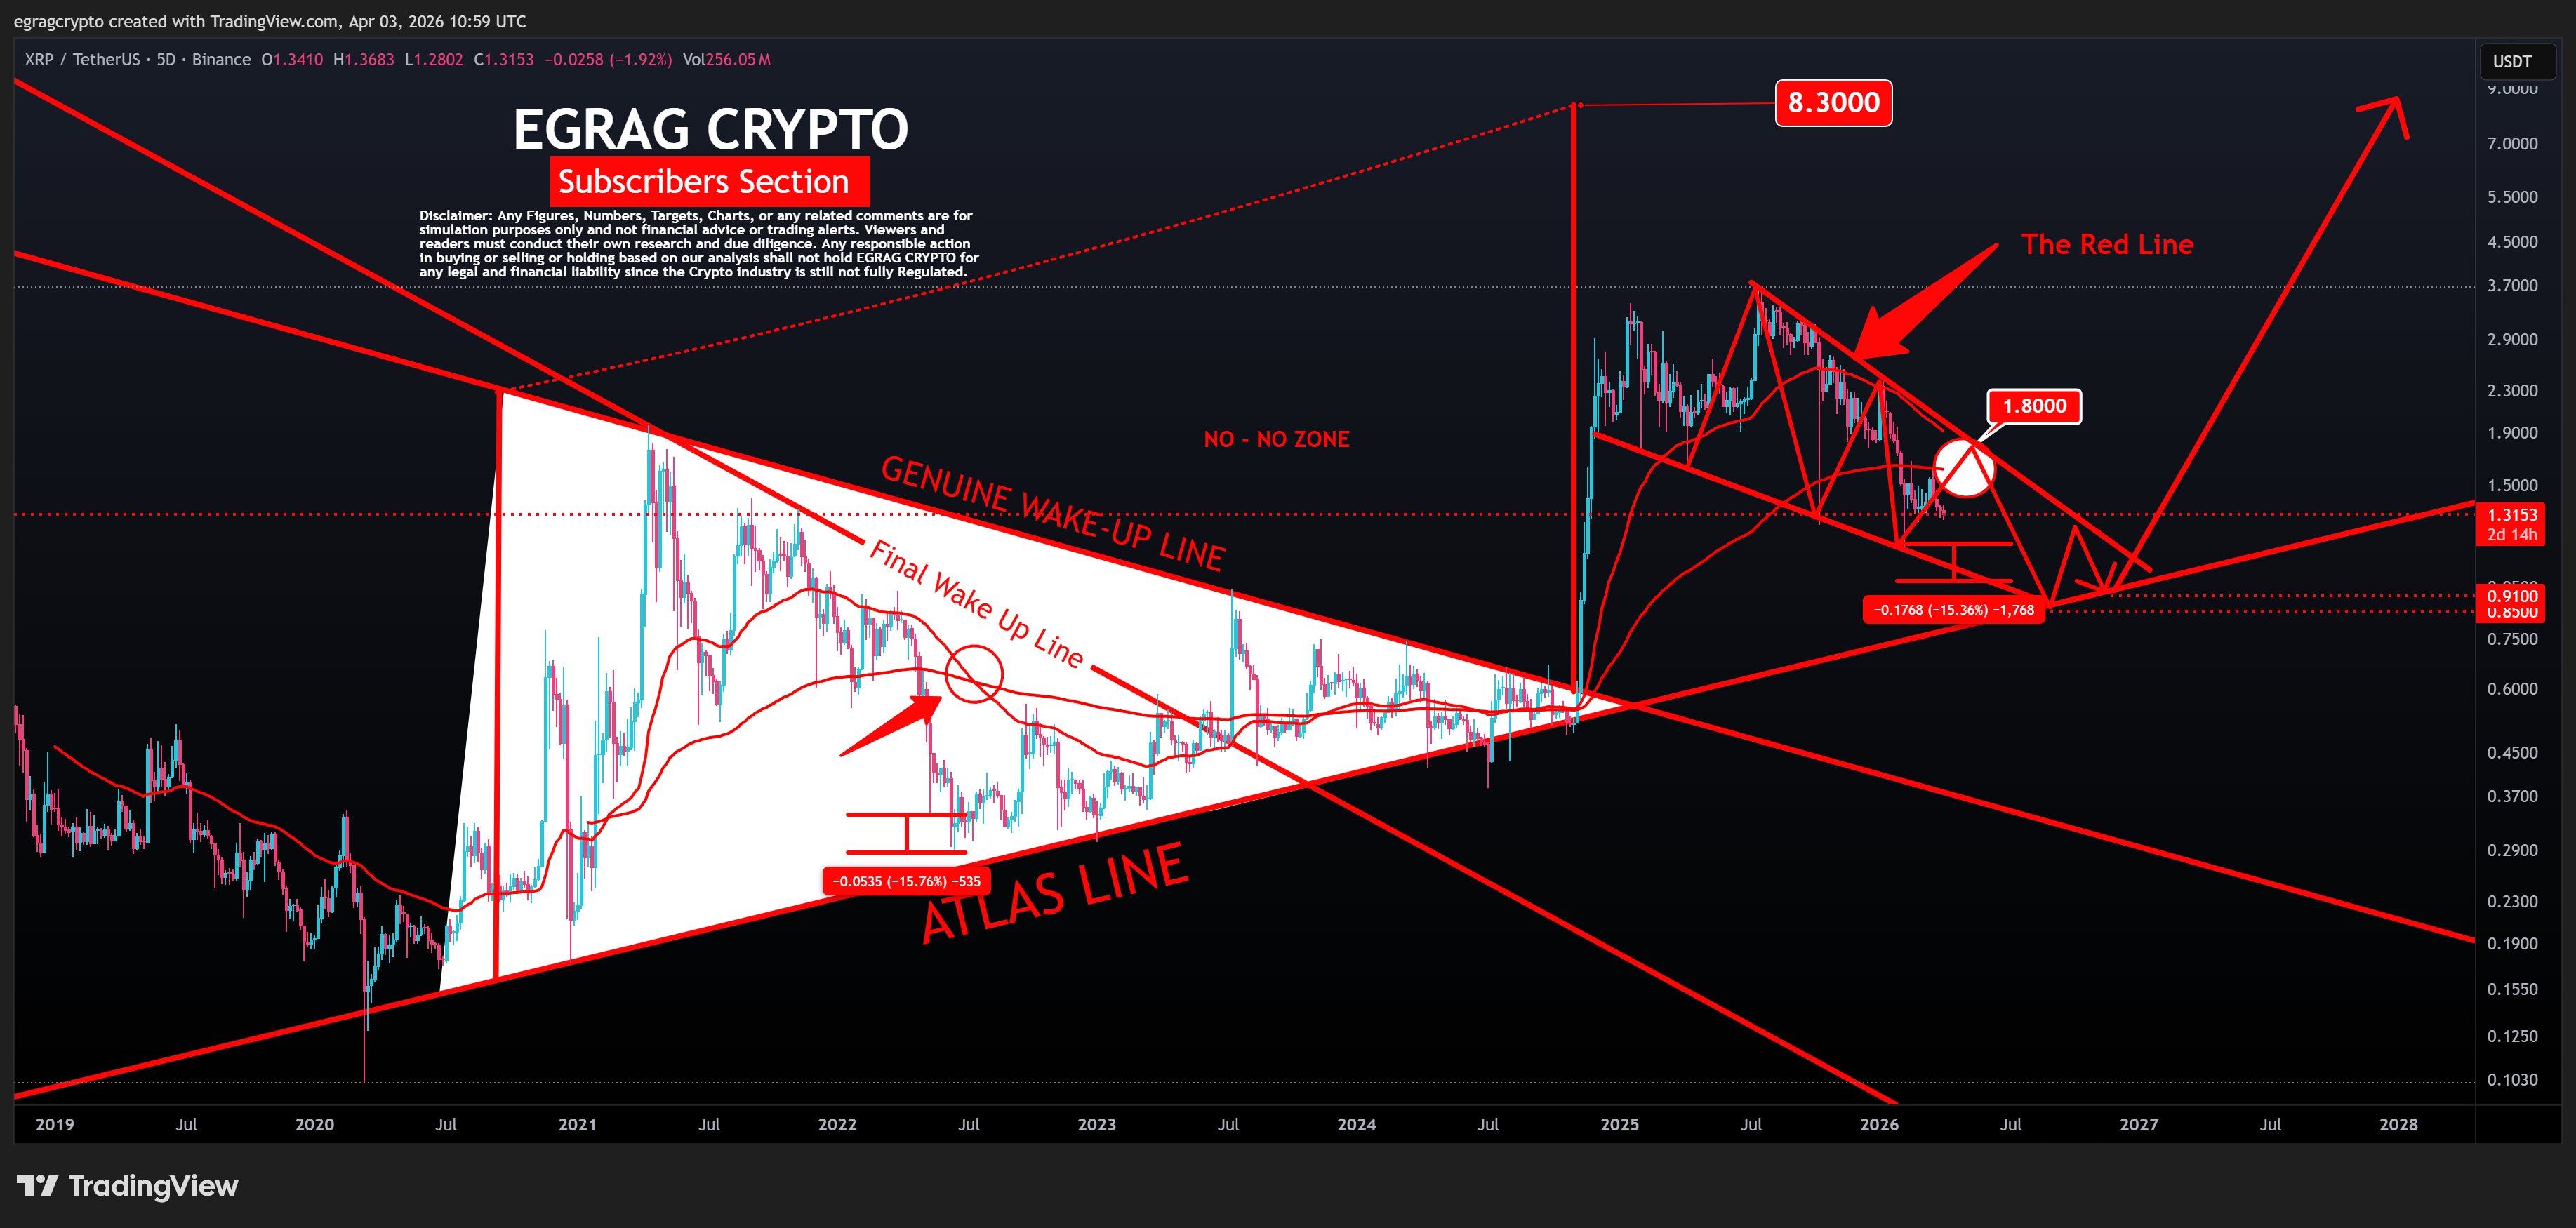
- XRP has followed a falling wedge pattern since the ongoing downtrend began in July 2025.
- During this period, the price has dropped from $3.6 to $1.3 after reacting at the upper and lower trendlines.
- XRP could again retest the upper trendline at $1.8 before witnessing a pullback toward $0.83, an intersection of the lower trendline and the Atlas Line.
- If XRP respects the Atlas Line, a confirmed breakout could drive a larger move toward $8.30.
XRP Falling Wedge Presents Buying Opportunity
This is according to a recent analysis from market commentator EGRAG Crypto. Notably, he pointed out that XRP is trading within a falling wedge, a pattern that often leads to potential bullish recoveries, amid the ongoing downturn.
From October 2025, XRP has now recorded six straight months of declines, its longest losing streak since 2014. The trend has continued into April, where XRP is already down 1.81%, putting it on pace for a seventh consecutive monthly loss, the first in history.
The falling wedge structure started forming after XRP dropped from the $3.6 high in July 2025. It includes a descending resistance line at the top and a support line at the bottom, with the price moving between both levels. XRP has tested these lines several times, showing that the pattern holds.
According to EGRAG, while the chart looks bearish at first, it may actually present one of the strongest buying opportunities, as the price continues to compress within this structure.
Historical Reactions Within the Wedge
The wedge has already reflected several key price movements. During the infamous market crash on Oct. 10, 2025, XRP fell from $2.8 to $1.378, touching the lower trendline. This level held as support and pushed the price back above $2 shortly after.
In early 2026, XRP attempted a recovery and climbed to $2.41 on Jan. 6, 2026, where it tested the upper trendline. However, it could not break through, and the resistance led to another pullback.
The pressure continued in early February 2026, when XRP dropped to $1.1 by Feb. 6, 2026. Once again, the price touched the lower trendline, and support held firm, leading to another bounce. These repeated reactions show how important both trendlines have been in guiding the price.
Critical XRP Price Levels and the Atlas Line
At the moment, XRP trades around $1.3, sitting within the wedge. The next possible move could take it toward $1.8, where it would test the upper resistance again. However, this level may be difficult to break and could lead to another rejection.
If the price fails at $1.8, the chart suggests a possible drop toward a major long-term upward sloping support trendline called the Atlas Line, which aligns with the wedge support at about $0.83.
After reaching $0.83, data from EGRAG’s chart indicates that XRP could bounce back above $1, then pull back again to test the Atlas Line around $0.91 before making a stronger upward move.
XRP Breakout Conditions and Long-Term Target
After retesting the $0.91 support, data shows XRP could then push toward the upside target at $8.30, which confirms the large breakout move if the bullish case plays out. At the same time, EGRAG also highlighted $0.83 as the major bottom level within the current structure.
However, the chart shows that if XRP closes above the upper trendline at $1.80, this would cancel the falling wedge pattern and negate the current setup. In addition, a drop below the Atlas Line support around $0.83 to $0.91 would indicate deeper weakness and raise the risk of further decline.


No Comments