


作者:CryptoNewsFlash
- On-chain momentum has shifted into the pessimism zone, signaling a heightened risk of a deeper Bitcoin correction.
- Composite Index shows weakening market confidence, with short-term holders likely to secure profits if momentum continues falling.
The Bitcoin market has been swinging sharply once more, and the latest pullback feels tougher than what traders have dealt with lately.
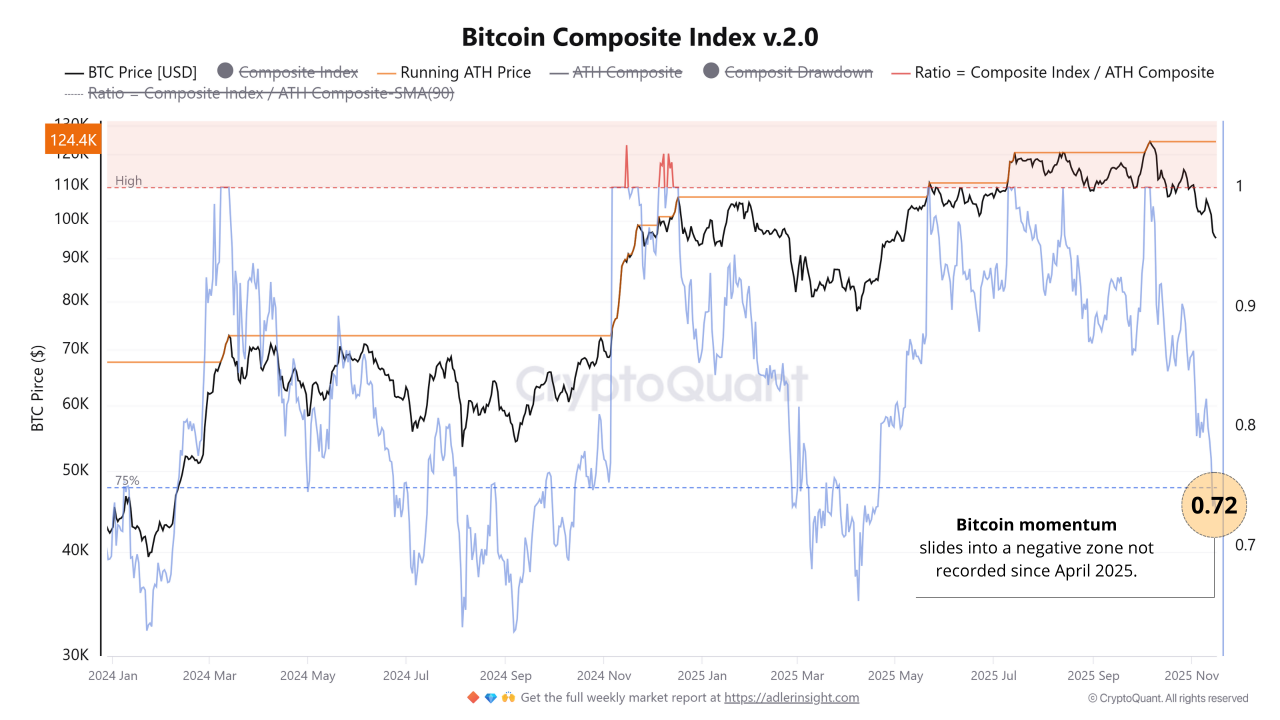
According to on-chain data highlighted by GugaOnChain, market momentum has fallen into the Pessimism “Correction” zone as the Bitcoin Composite Index ratio approaches 0.72, a threshold not touched since April 2025.
This figure could raise the possibility of a deeper correction looming. Moreover, the current price, which is around $91,000, appears to be unstable.
BTC Price Pathways Based on Current Momentum Signals
GugaOnChain explained that a drop in the Bitcoin Composite Index ratio below 0.75 typically triggers profit-taking from short-term holders. If this pressure continues, the price could fall further towards the $87,500 area, a level that has served as a buffer since March.
Furthermore, the analyst mapped out several possible market directions. If the ratio remains between 0.8 and 1.0, Bitcoin is likely to move sideways within the $90,000–$110,000 range. This zone typically indicates declining interest, with market participants choosing to wait rather than increase risk.
However, if the Bitcoin Composite Index ratio eventually returns above 1.0, the bullish scenario could reopen, with the price potentially moving towards $150,000–$175,000. Such movements have occurred in the 2017 and 2021 cycles, so there’s nothing particularly new here.
On the other hand, selling pressure from the derivatives and spot markets cannot be ignored. A previous CNF report showed that since October 26, Binance has received over 35,000 BTC. Such a large inflow typically indicates fear, as many investors choose to move assets to exchanges when they want to sell.
The price drop from $114,000 to $93,000 over the same period reinforces the growing selling pressure.
Key Technical Zones That Could Influence Bitcoin’s Next Bounce
From a technical perspective, crypto analyst Ted observes a fairly thick liquidity cluster in the $90,000–$92,000 range. This zone also happens to contain a CME gap, and as usual, such gaps often act as price magnets.
If the gap is filled, the opportunity for a relief bounce will open, especially if buyers begin to show courage at the right moment. Sometimes, the market just needs a little push to bounce, even if the broader context remains shrouded in fear.
$BTC has a decent liquidity cluster around the $90,000-$92,000 level.
This zone also has a CME gap, which will most likely get filled.
After that, a relief bounce is expected if buyers step in. pic.twitter.com/CStlfqONwm
— Ted (@TedPillows) November 17, 2025
Not only that, in recent days, Bitcoin Fear and Greed index has entered the fear zone, then dropped back down to the extreme fear zone. This state has often appeared before major rebounds in the past, although there is no guarantee that history will repeat itself.
However, for some contrarian investors, extreme fear is sometimes seen as an incoming “seasonal discount.”
Meanwhile, the global liquidity situation is also dampening market momentum. Expectations for a Fed interest rate cut are also constantly changing, making price dynamics increasingly difficult to predict.
Weaker liquidity typically increases volatility, and that’s what was seen throughout last weekend.
As of press time, BTC is changing hands at about $91,316, up 1.11% over the last 4 hours, with $16.44 billion in daily trading volume.
No Comments